Investment Research & Advisory


  1. Climate Change Investing – Does COVID-19 Warrant Greater Risk Assessment for Investors?

    The COVID-19 outbreak is sparking another debate on the side-lines – societal and economic preparedness to f

      to read | words

    The COVID-19 outbreak is sparking another debate on the side-lines – societal and economic preparedness to face Black Swan events such as these and the catastrophes they lead to. Also, whether a far greater assessment is necessary to evaluate the risks they present. One such ongoing event with the potential for major disastrous consequences is climate change.

    The world is battling one of the worst pandemics, with few known precedents. Virus outbreaks such as the Spanish Flu in 1918 and the more recent SARS in 2003 pale into insignificance in terms of economic and social impact.

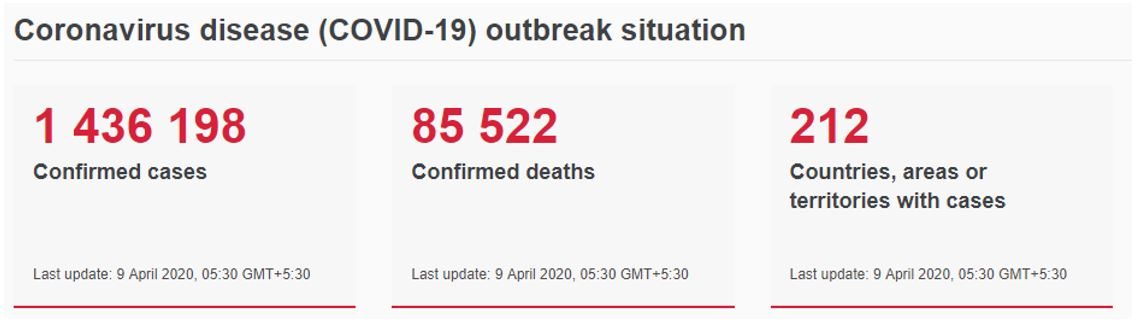
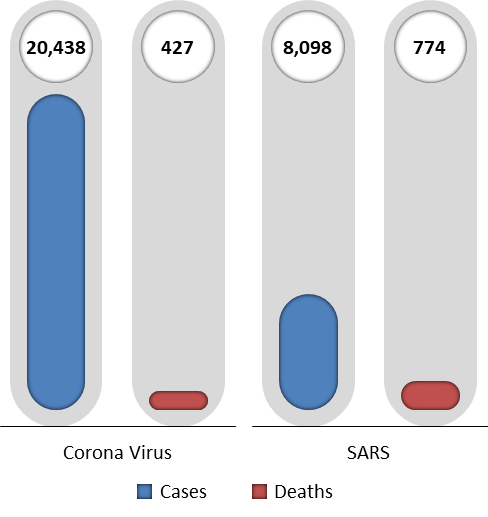
    The current outbreak is yet to show any signs of abatement. New cases and deaths continue to be on an upward trajectory, with the US, Italy and Spain at the forefront. China, once the epicenter, has shown significant progress in controlling the outbreak, as also other Asian countries such as South Korea, Japan and Singapore. However, as the saying goes, ‘it may get worse before it gets better’.

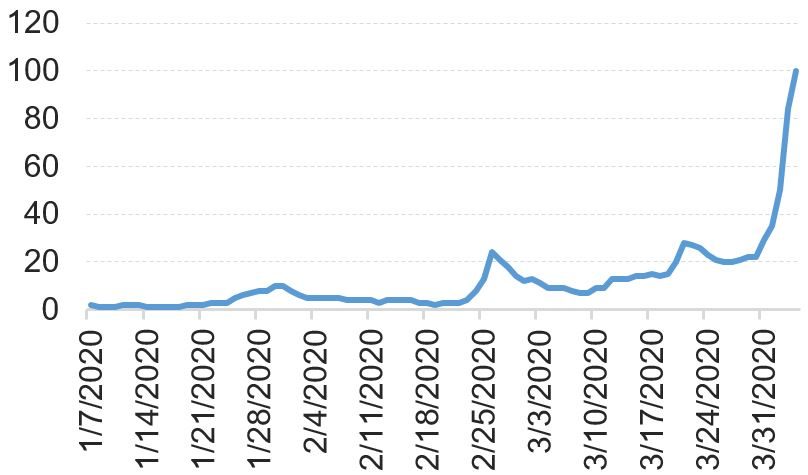
    Total confirmed COVID-19 cases

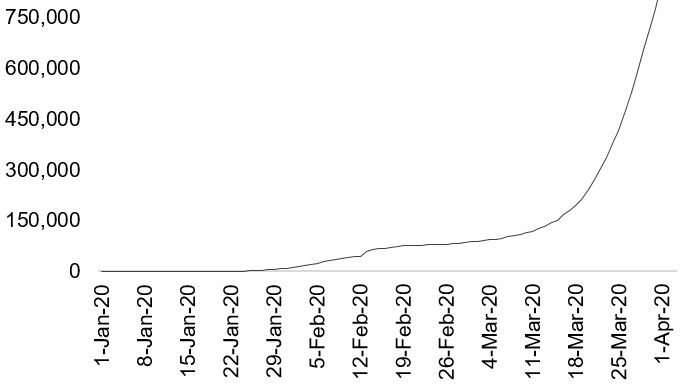
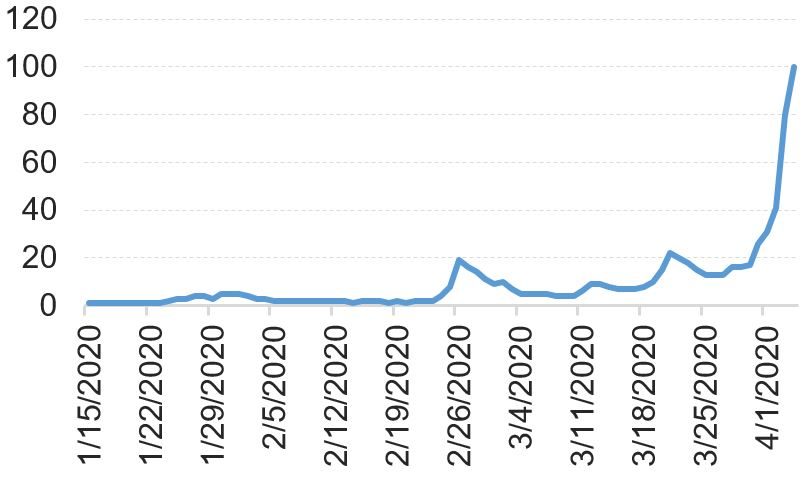
    Total confirmed deaths due to COVID-19 (deaths)

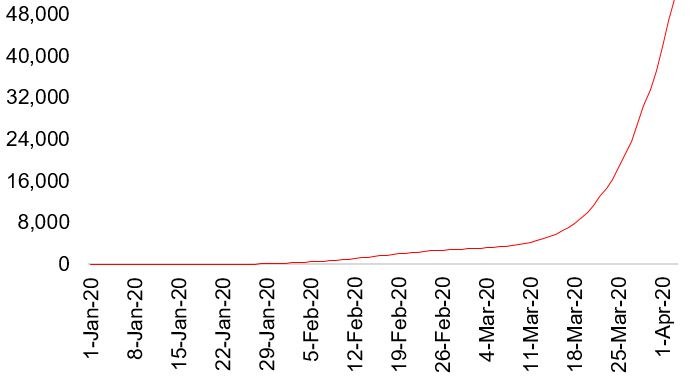
    Source: European Centre for Disease Prevention and Control

    COVID-19 and climate change connection – The outbreak is sparking another debate on the side-lines – societal and economic preparedness to face Black Swan events such as these and the catastrophes they lead to. Also, whether a far greater assessment is necessary to evaluate the risks they present. One such ongoing event with the potential for major disastrous consequences is climate change. While Greta Thunberg may have made climate change a hashtag item, social awareness is but a small step.

    There is a big difference between how governments and companies are reacting to COVID-19 and how they have been dealing with the implications of climate change. The former is a crisis right at our doorsteps with the potential to not only derail the global economy temporarily but also inflict several casualties. Responses, therefore, have been swift and involve trillions of dollars in stimulus packages and possibly even bailouts.

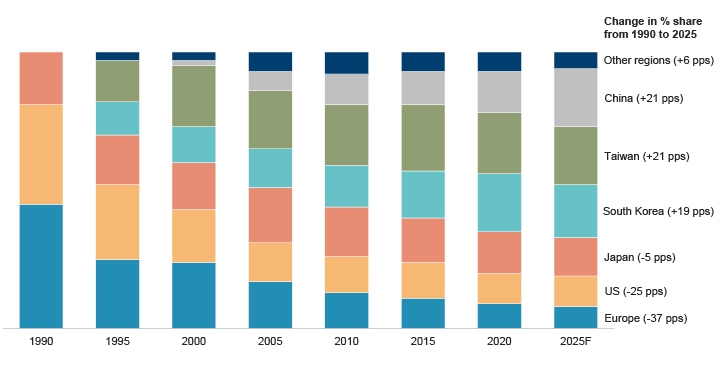
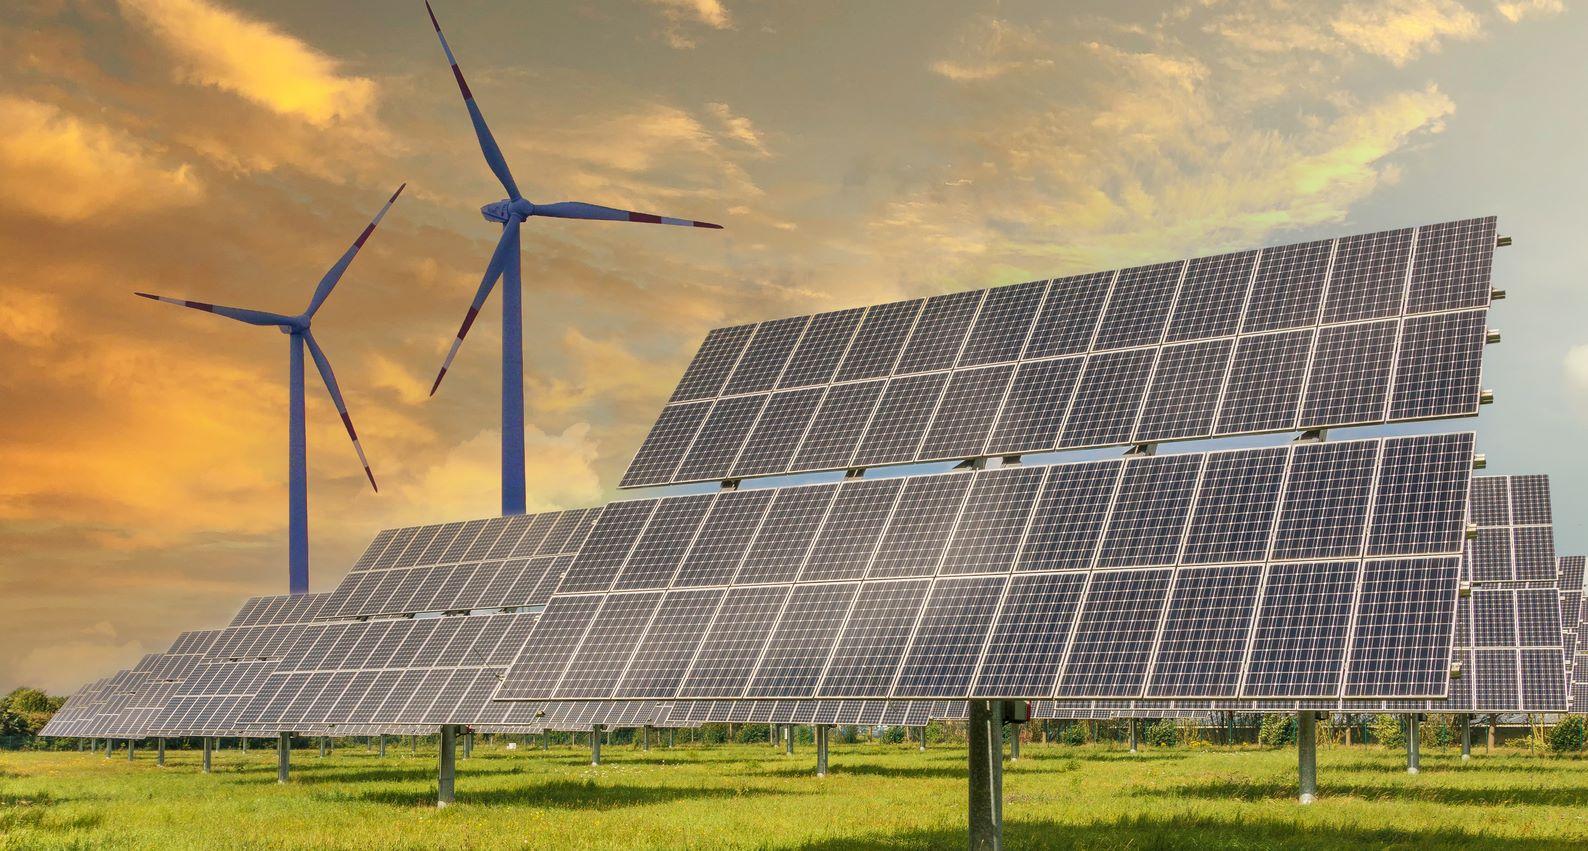
    Climate action, on the other hand, is turning out to be a long-drawn-out affair, with country-wide targets of emission controls, preservation of forestlands, and reduction in usage of plastics being set over multiple decades in the future. Here’s how major contributors to global climate change stack up and the targets they have set for themselves:

    Share in global GHG emissions in 2017

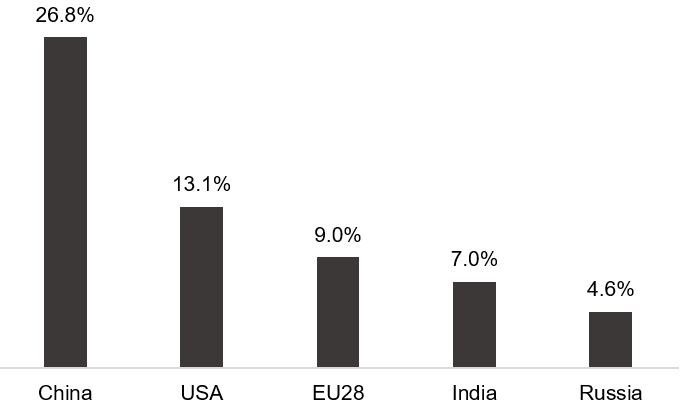
    Projected per capita GHG emissions in 2030 in tCO2e/cap & change from 2010 levels (RHS)


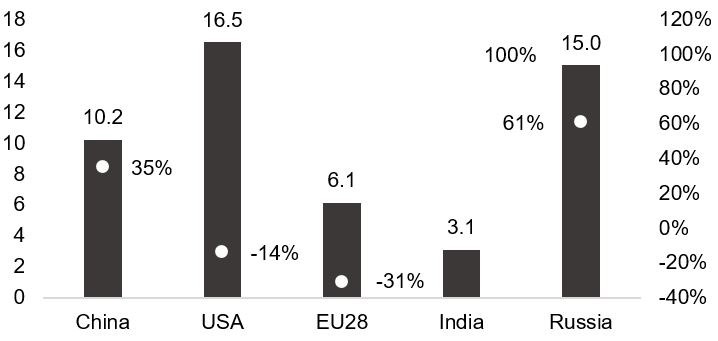
    Source: 2019 United Nations Environment Programme

    From the statistics above, one thing is quite clear. Emerging countries are the top contributors to climate change globally; their per capita emissions are likely to reach the peak in the current decade before declining. The immediate onus, therefore, lies with developed economies to push the Paris Accord agenda, which calls for limiting global warming to under 2.0°C by 2100 over pre-industrial levels.

    Based on projected levels, the US and EU are still some distance away from this target. By the end of this decade, the US is projected to reduce per capita emissions by 14%, while the EU by 31%, over their 2010 levels.

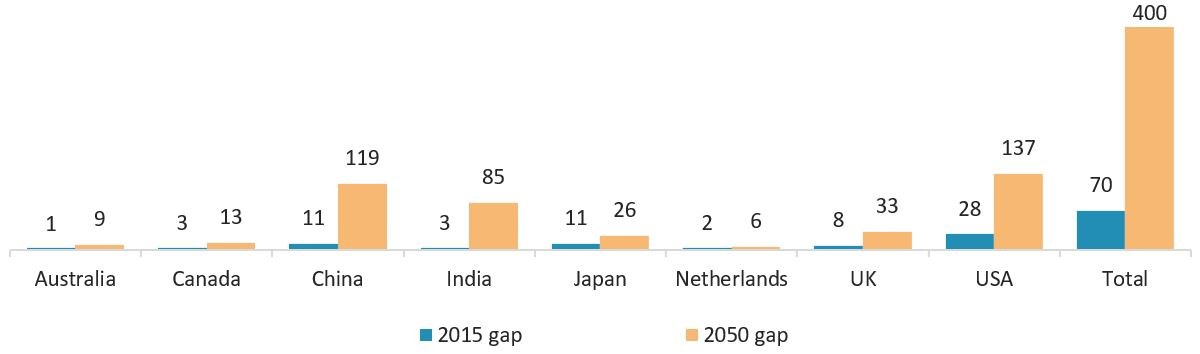
    Implications of slow march toward necessary climate action – We believe the current pandemic and the social and economic costs associated with it could bring a structural shift in how risks linked with these disasters are assessed. Climate change alone has resulted in at least five major catastrophes in the previous decade that have caused significant loss of property and lives. Over the past three decades, climate change-related disasters have gone up three times, the rate of increase in sea level in the 21st century has been higher than in all of the previous one, and over 20 million people a year are being displaced as a result of these events. The United Nations Environment Programme has estimated that emerging countries are likely to lose as much as $140–300 billion per year by 2030 due to climate change-related disasters.

    • The Australian bushfire season of 2020 is the most recent that followed one of the hottest summers in the continent. The fires left 28 people dead, 10 million hectares of land impacted, and millions of lives affected. It killed over a billion native animals.
    • Droughts in East African countries such as Ethiopia, Kenya and Somalia between 2011 and 2019 left 15 million people in need of serious aid of food, water and shelter. Not to mention, these negatively impacted crops and livestock.
    • Floods over the past 12–18 months in South Asian countries such as India, Nepal and Bangladesh have been the worst in 30 years. These floods, exacerbated by rising sea levels, displaced over 12 million people.
    • Cyclones Idai and Kenneth ravaged Zimbabwe, Malawi and Mozambique, killing over 1,000 people and rendering millions homeless and without food and basic supplies. A fact to be noted, northern Mozambique that was ravaged by Cyclone Kenneth had not seen a cyclone in over five decades.
    • El Niño is causing longer and more severe droughts in South American countries such as Guatemala, Honduras, El Salvador and Nicaragua. Amid the resultant crop failure, 3.5 million people have been pushed to seek humanitarian aid.

    Sea Height Variation (mm)

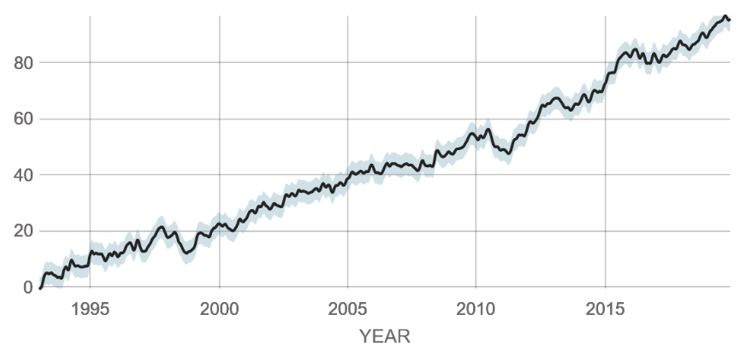
    Temperature Anomaly (°C)
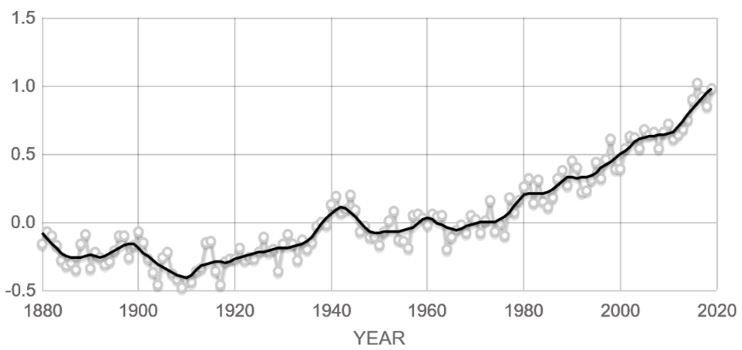
    Source: NASA

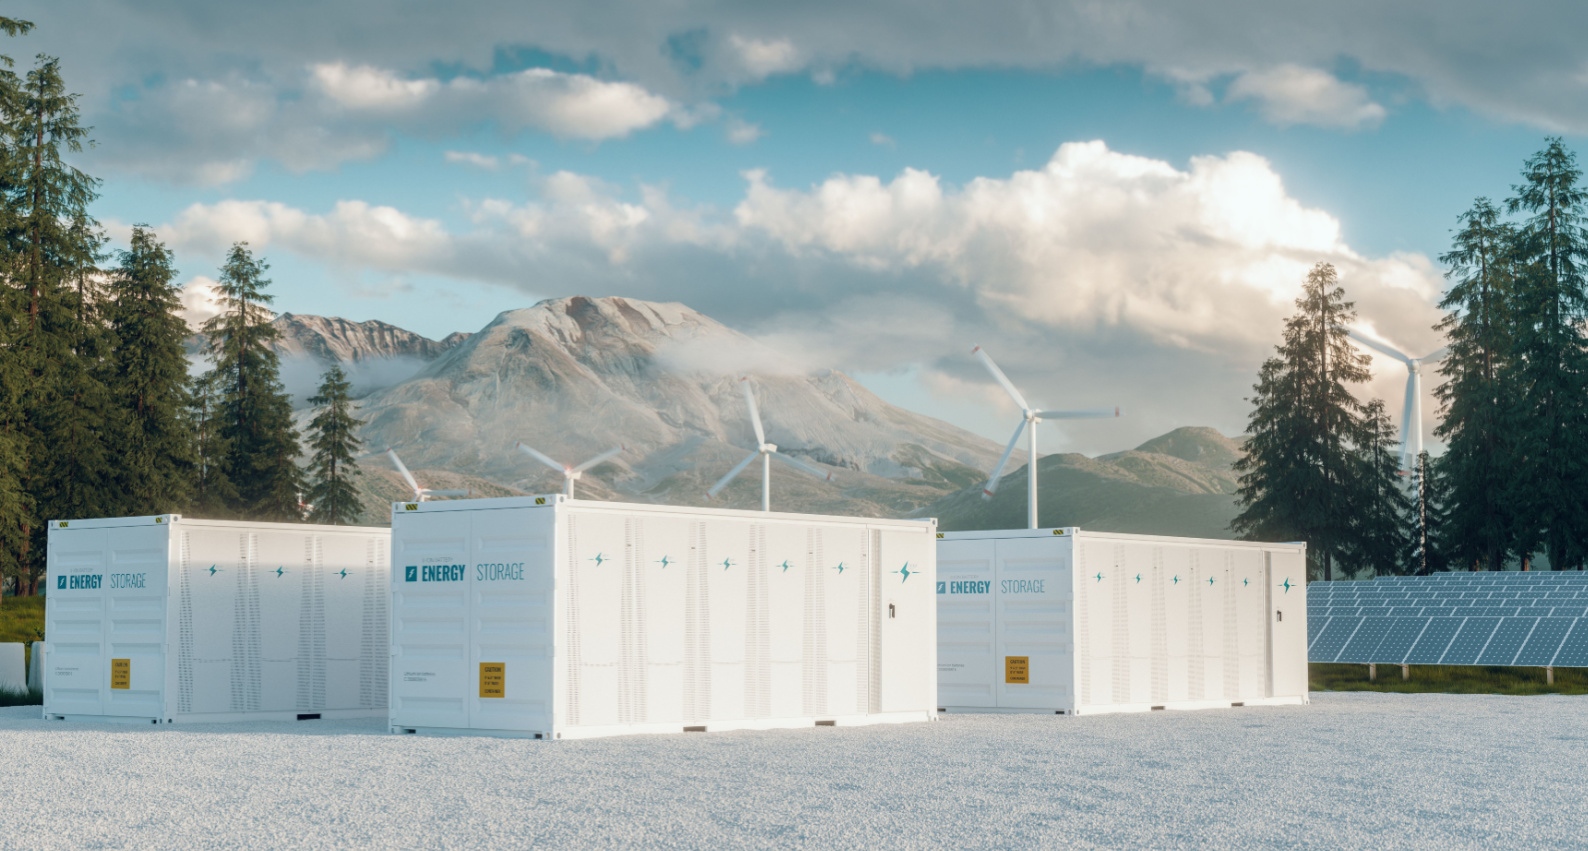
    Role of global institutional investors – Political headwinds to climate action such as bureaucracy, lack of bipartisanship and corruption are unlikely to change anytime soon. We, therefore, believe that the global investor community can play a big role in influencing change, at least at the corporate level. We see significant scrutiny being applied to corporate carbon footprints, ESG investments and roadmaps and the managements’ ability to take concrete steps in mitigating the effects of climate change. Investors are likely to reward companies directly contributing to the prevention of adverse climate change.

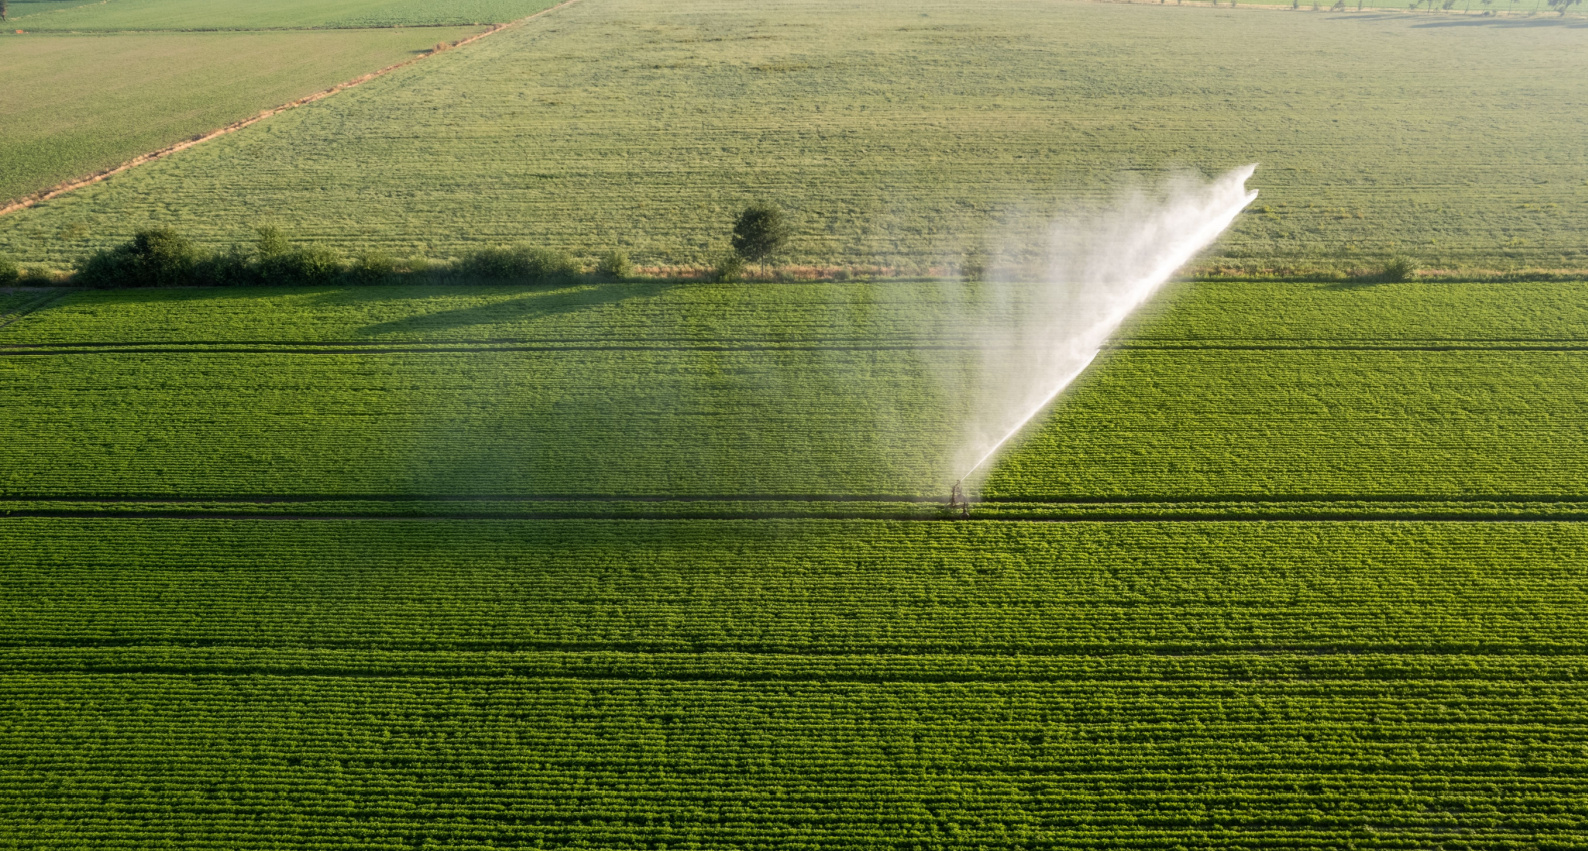
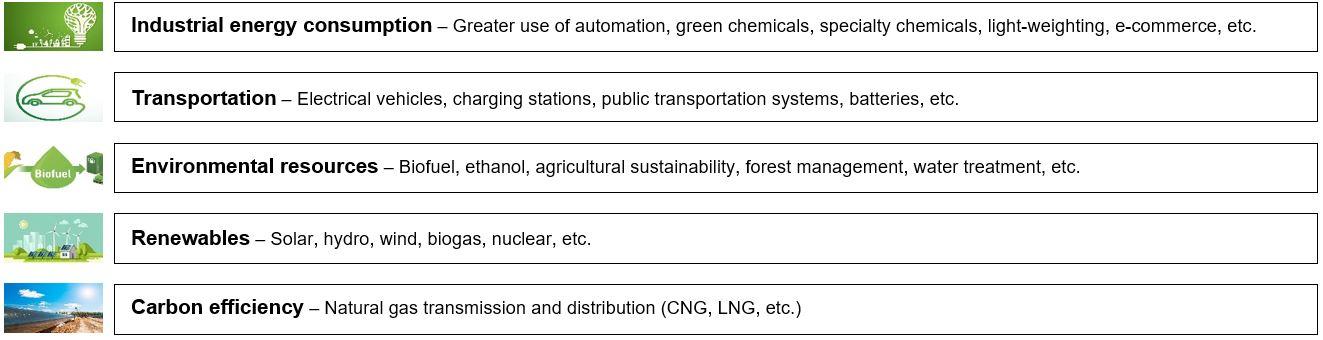
    The following long-term investment themes are expected to gather steam during the present decade. Not only do we expect an increase in ESG-focused investment funds and strategies but also more opportunities as part of the following themes. Investors will likely increase quantitative measures to value fund performances based on ESG metrics, carbon emissions by portfolio companies, water treatment and use of non-hazardous materials.


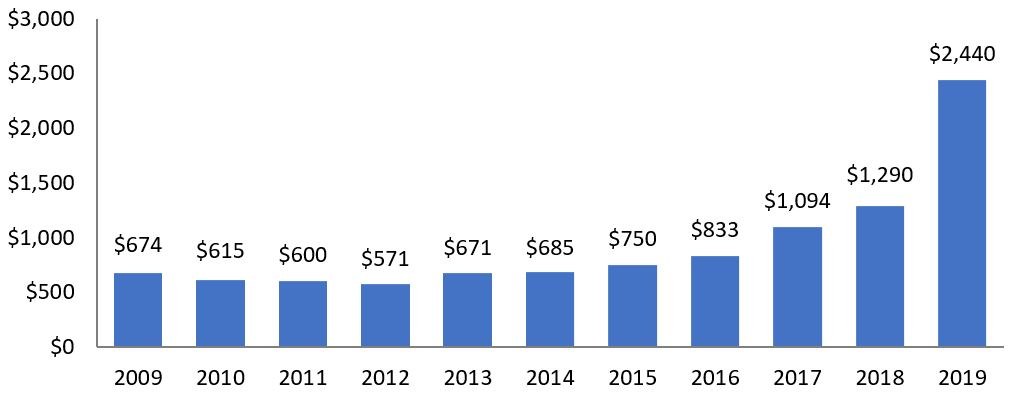
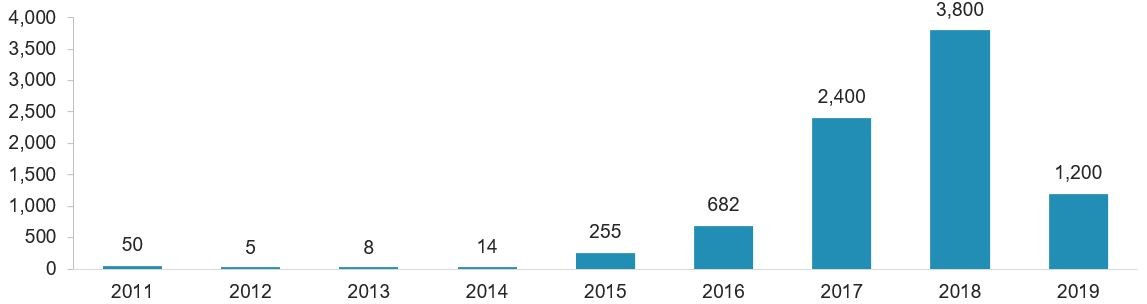
    Current state of ESG-focused funds – Since 2016, the number of funds that have added ESG as an investment criterion has gone up many folds. Interestingly, the Paris Accord was signed just the previous year in December, a coincidence of sorts! During 2019, almost 500 funds added ESG to their prospectus, compared to a little over 50 in 2018 and a handful in 2017 and 2016. As per Morningstar and as of the end of 2019, the total AUM of funds with ESG consideration was a little over $930 bn, with 23 funds over $1.0 bn in individual AUMs. We believe that most of these funds focus on ESG parameters for existing companies around the world, and only a fraction of them invested in pure-play companies with defined climate action strategies and businesses.

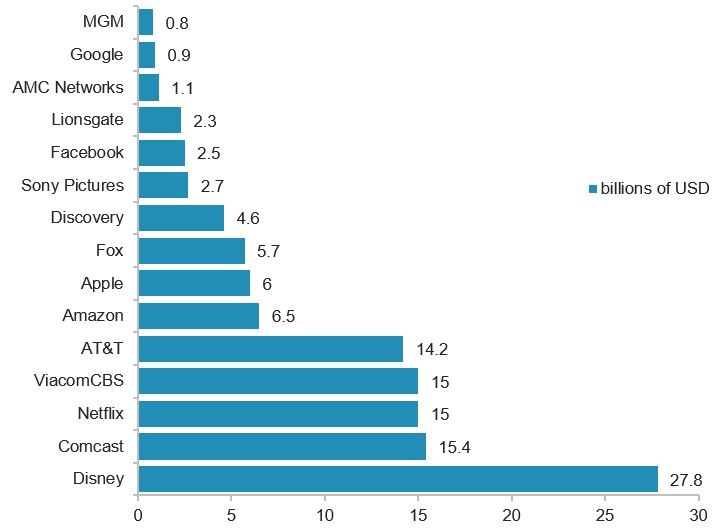
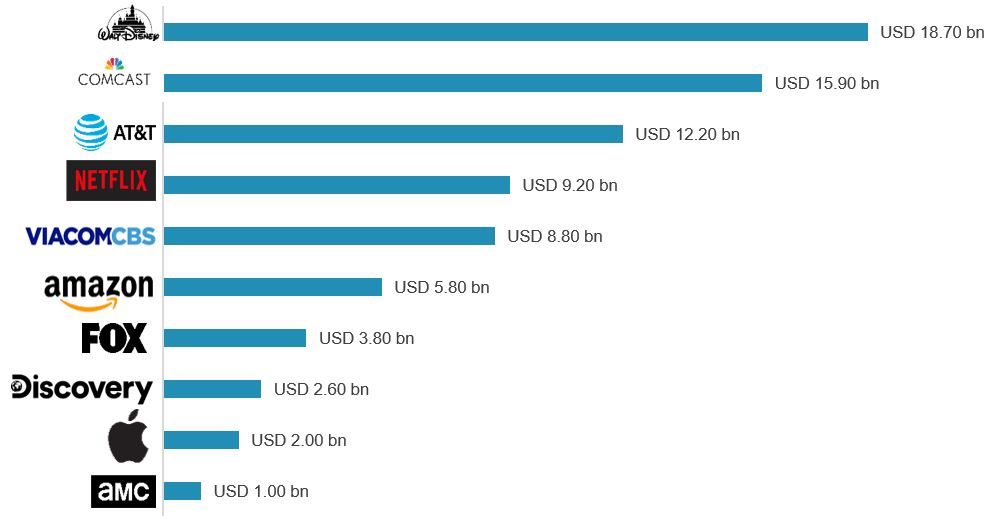
    Ten Largest ESG Consideration Funds (AUM $ bn)
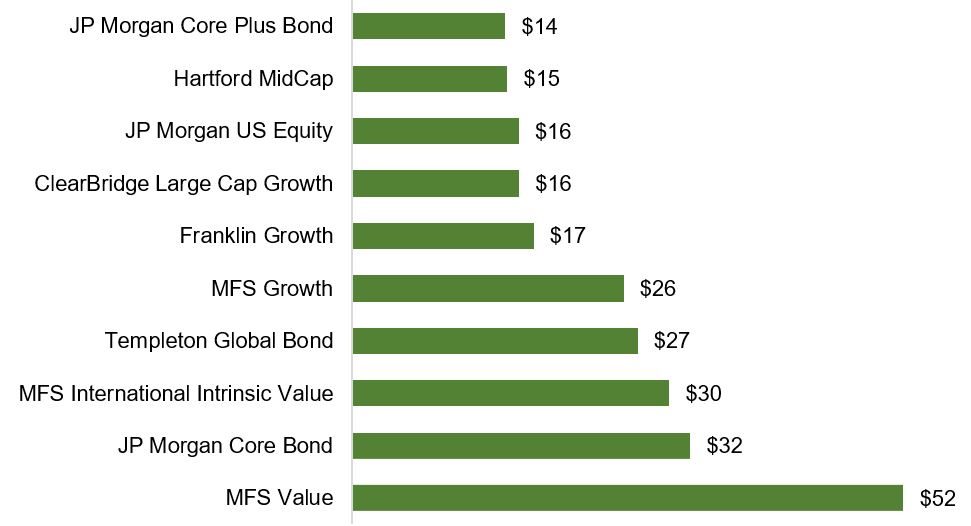
    Source: Morningstar

    It all comes down to MAP approach (Mitigation, Adoption & Prevention) – When the dust settles on COVID-19, trillions of dollars would have been wiped out from the global economy and stock markets. The lesson for governments around the world and for investors is to be proactive and mitigate the impact of such catastrophes, adopt stringent regulations and policies, and subsequently prevent devastation of such magnitude. The investor community can in no way remain immune to events such as these or to the ones that are likely to come about as a result of adverse climate changes. However, a much greater risk assessment is needed of companies at the forefront of contributing to changing climate conditions globally, while higher value should be placed on those adapting to stem that change. Every dollar of capital investment must be looked at from this perspective.

    The effects of global climate change seem slow and long-term, but the natural disasters they cause are increasing in frequency and scale. Tsunamis, floods, forest fires, droughts and epidemics, all have the potential to cause severe damage to economies (including investor wealth) and livelihood. We believe COVID-19 should be an eye-opener in terms of the risks we face due to such disasters.

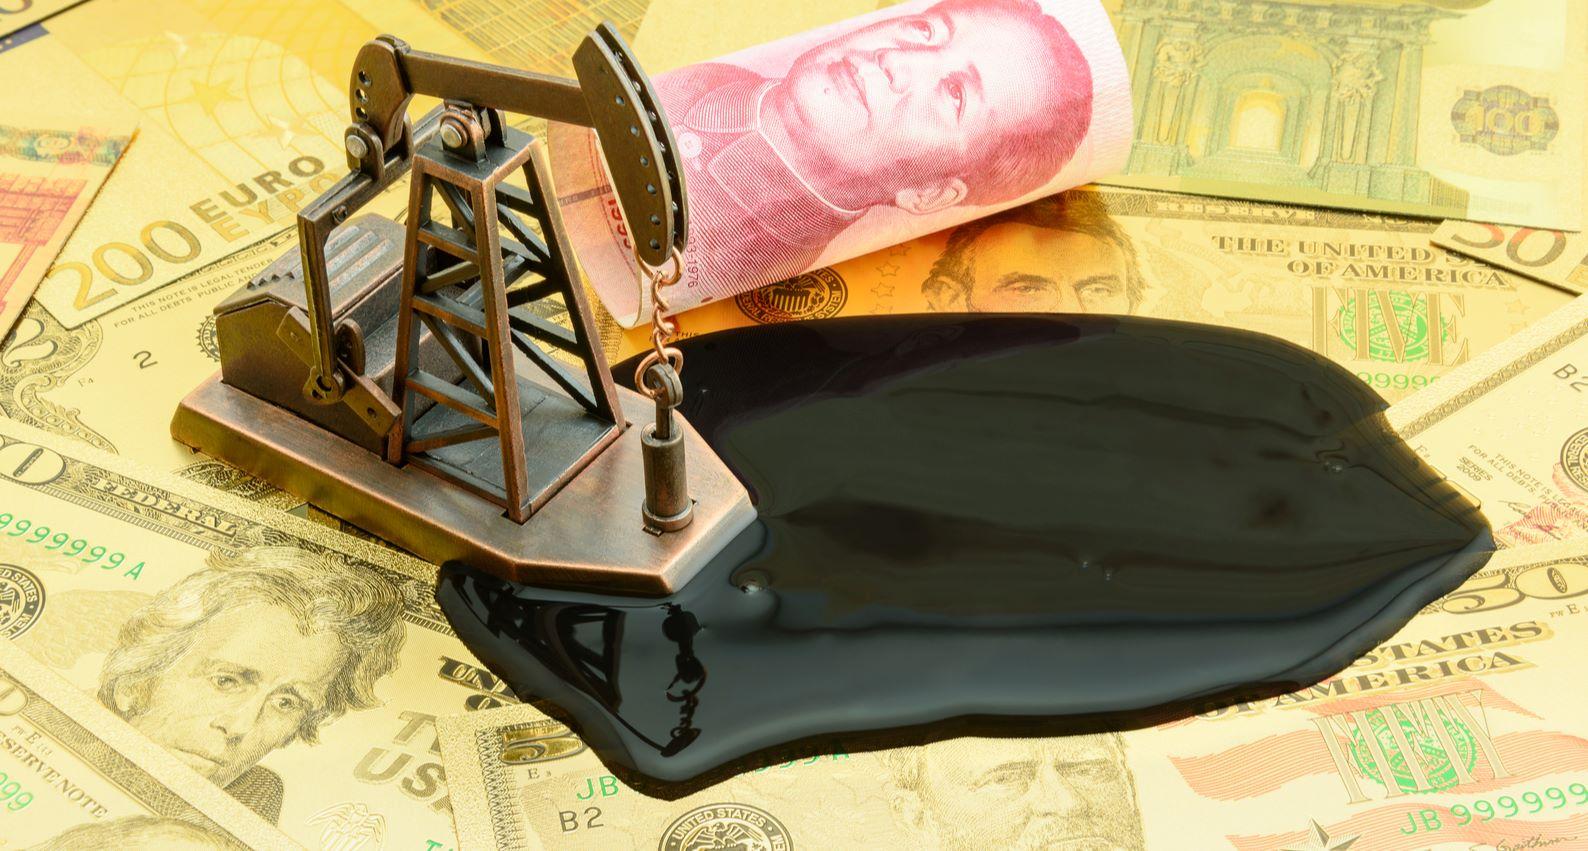
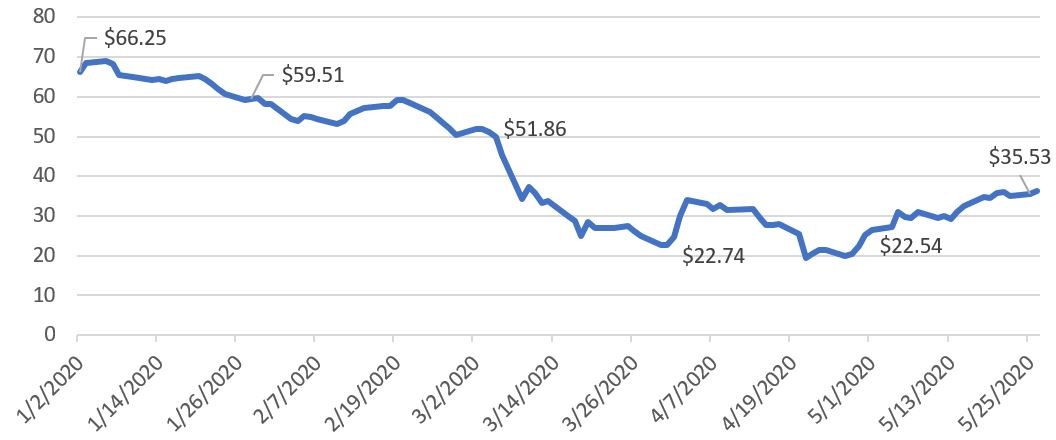
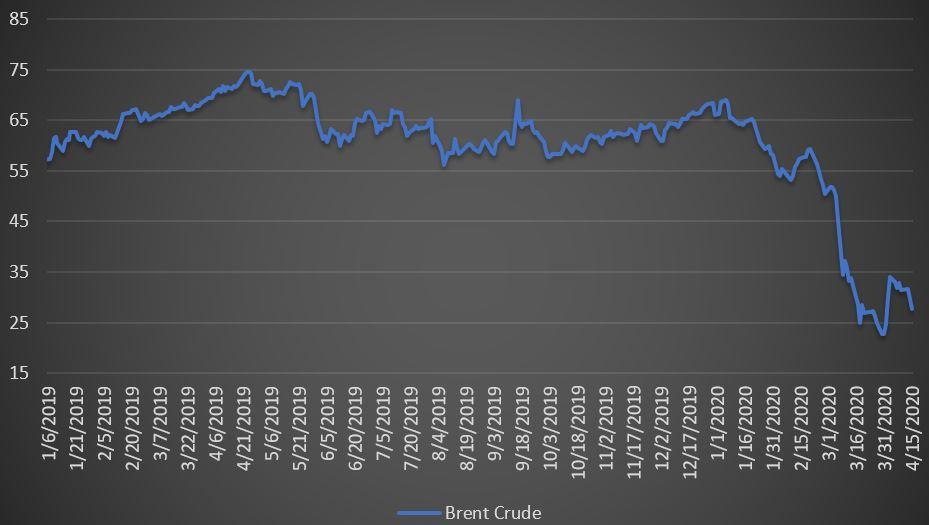
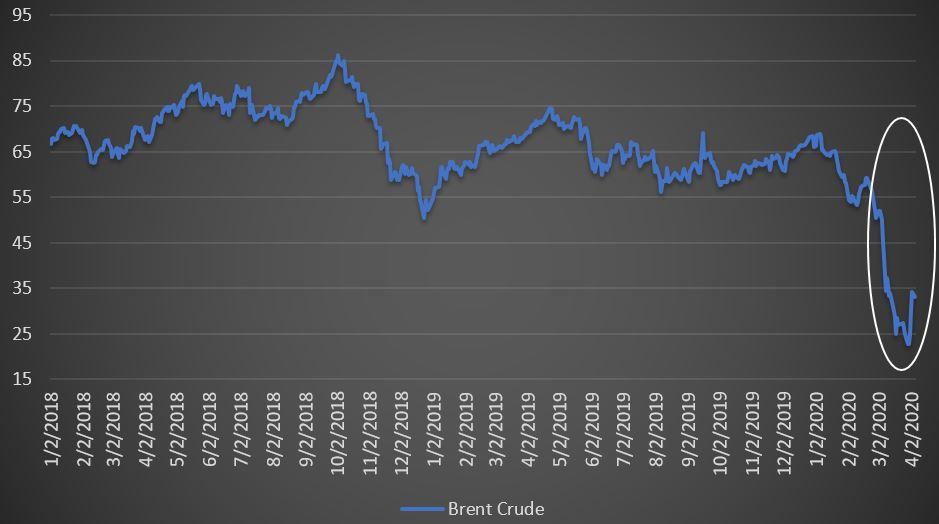
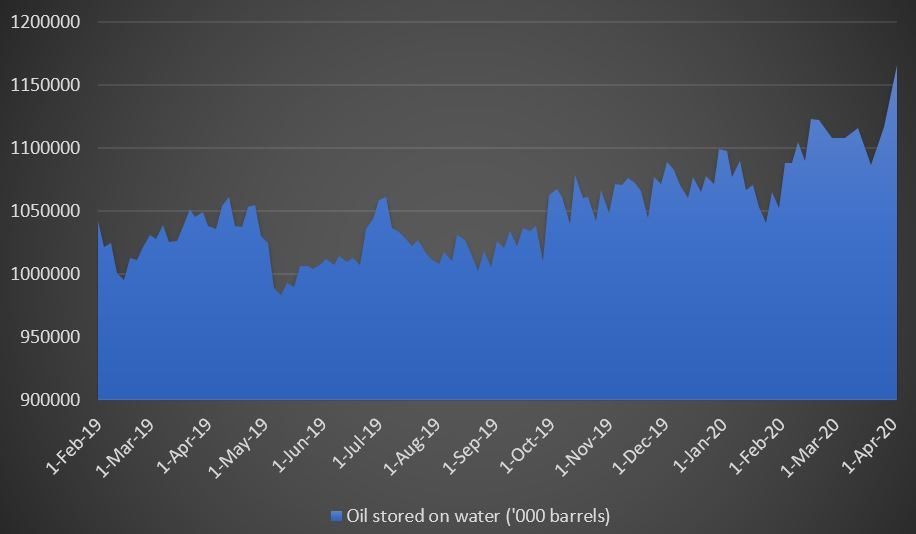
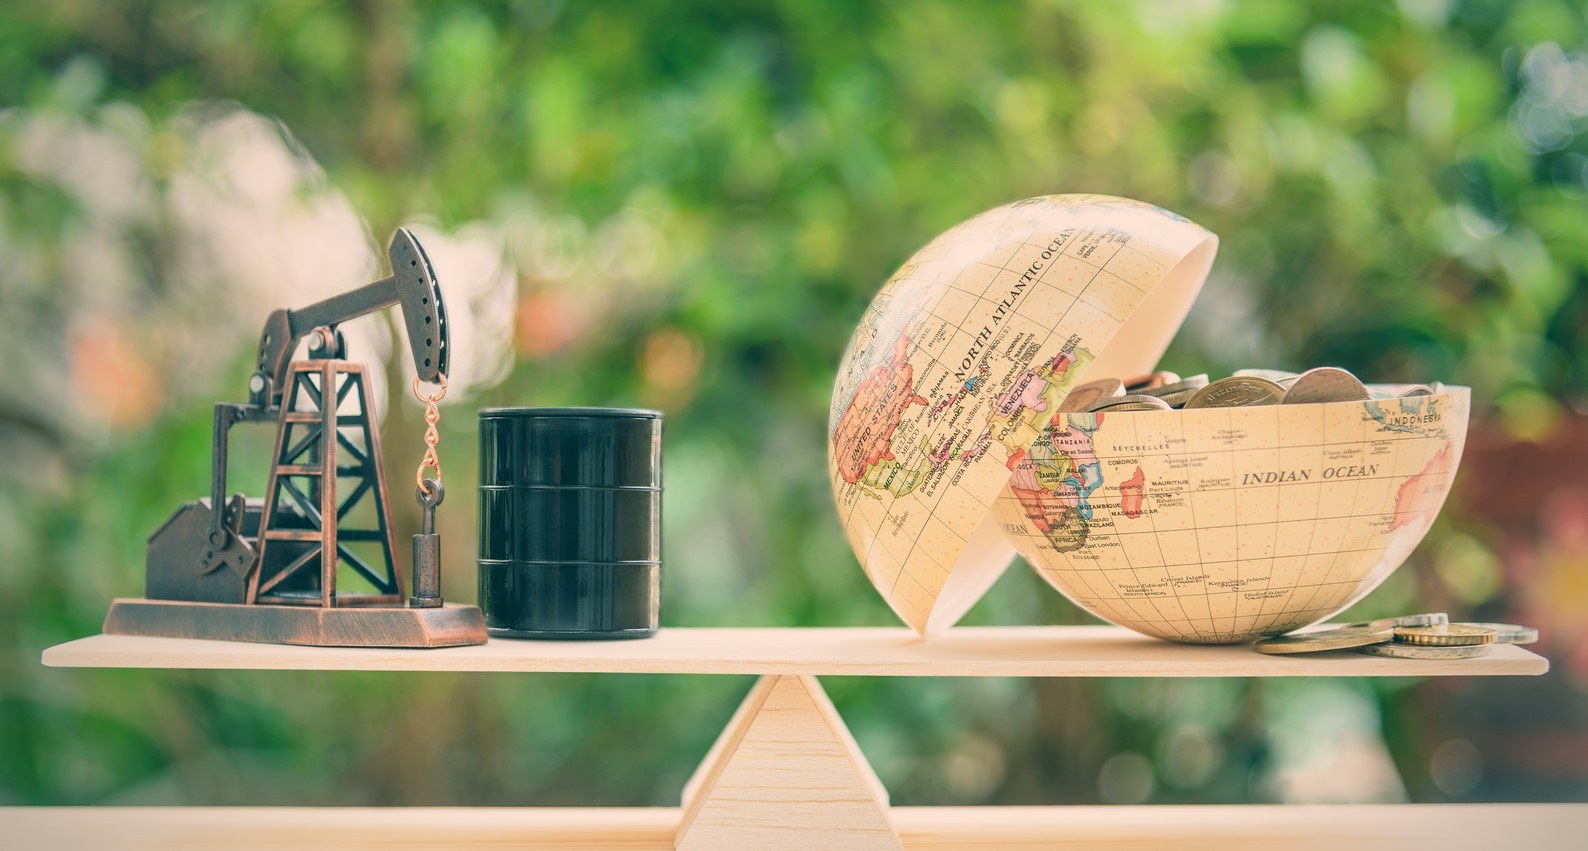
    Beware of temptations – Finally, the COVID-19 outbreak and the following mass lockdowns have led to a significant drop in pollution levels. The economic shutdown has also resulted in a sharp fall in oil prices. These are obvious ingredients for governments, companies and investors to temporarily drop the guard in their climate action initiatives, in an attempt to shore up economic activity. Any short-term change in climate action strategies will only increase the risks of more such economic shocks. Hence, its essential that enterprises do not lose sight of their commitment towards the climate and continue with their efforts to remain sustainable.


  2. Founder’s Stock Sale — How Not to Turn it Into a 409A Nightmare

    A Founders’ Stock sale can have serious and far reaching implications on the pricing of s

      to read | words

    A Founders’ Stock sale can have serious and far reaching implications on the pricing of stock options due to 409A provisions.
    While the extent of the impact can vary significantly, it’s important to understand when this affects companies the most as well as how they can structure such transactions to mitigate these effects.

    Trends indicate that venture capitalists have increasingly become comfortable with providing partial liquidity to the founders, which often occurs during new financing rounds. In most cases, this is achieved by facilitating the buyback of a portion of the Founder’s equity (typically common stock) by the Company out of proceeds of preferred financing round or sale of founder’s equity directly to the investors.

    Founders typically own common stock, and while common options are valued at 15%-40% of preferred stock price (depending upon the company’s stage of development), founders’ stock is mostly sold at the preferred stock price. With the 409A regulation in place, such a transaction triggers the arm’s length presumption, and can lead to the Founder’s stock’s sale price arguably becoming the new benchmark for pricing future options.

    Needless to say, unattractively priced options can severely impact a company’s ability to maintain employee motivation — a situation that start-ups can ill afford.

    While a Founder’s stock sale certainly has an impact on 409A valuation, the degree to which it affects the company’s valuation varies significantly. What matters here is to understand when this impact is highest, and what a Company can do (before and after the transaction) to minimize the impact.

    Although the actual impact depends upon the facts and circumstances of each case, here are some factors that determine how the transaction price affects 409A valuation , and thus, be taken in cognizance by a CFO:

    • Is the Founder’s stock sale facilitated through Company buyback, or is it negotiated directly between founder and the investors?
    • If it is a buyback, and the Company has bought back common shares from founders, has it issued the same class of shares (common) to new investors, or has it issued a different class of shares (preferred) to new investors?
    • Was it a standalone transaction, or was it in conjunction with a capital raising transaction?
    • Was the option to sell shares restricted just to founders and/or a select group of management personnel, or was it open for all common shareholders.
      If yes, was there any limit on number of shares that can be sold as a part of the transaction?
    • What was the key objective of this transaction?
      Was it to give liquidity to shareholders/founders; or was the transaction structured to give a minimum required stake to new investors, without raising excess capital?

    An experienced Valuation Expert would evaluate all these questions, and much more, to see if (and how much) consideration is to be given to the transaction for 409A purposes. He can always identify any unique anomalies that limit such consideration, and demonstrate how the transaction price in question is not at arm’s length, and thus, not a good proxy for option price. More importantly, he or she needs to document all relevant data-points and arguments coherently in a 409A report.

    A skilled CFO on the other hand will make sure that:

    • He speaks with his 409A valuation firm during the initial stages of planning in order to understand the impact of the various transaction structures being considered.
    • He apprises investors on the need to be flexible with the transaction structure being considered in order to ensure there's no adverse impact on the company's 409A valuation.
    • He discusses the transaction's objectives (both the buyer's and the seller's) with his attorneys and valuation firm in order to determine the most suitable structure that meets their desired objectives.

    In the end, the 409A impact of a Founder’s stock sale should never be a reason to deny Founders their well-earned right to make partial exit, nor can it be allowed to affect your employee’s motivation. The job of a CFO and his valuation partner is to ensure the two don’t conflict, and a good understanding of some of the above points would go a long way toward ensuring that.

    --

    Manish is a CFA® and a qualified Chartered Accountant (CPA equivalent in India), with over thirteen years of experience in Business and Intellectual Property valuation across diverse industry sectors, particularly technology and healthcare. Manish is an expert in startup valuations and have signed off on over 1,500 409A valuations. His articles have been published on several reputed media platforms including TechCrunch and FirstPost.

    He currently heads the Aranca’s valuation group in US, managing client and partner relationships and is based in Aranca’s Palo Alto office.


  1. Disinflation – The How and Why of it

    In economics, fluctuations in inflation rates can significantly influence the financial landscape of businesses. While inflation tends to

      to read | words

    In economics, fluctuations in inflation rates can significantly influence the financial landscape of businesses. While inflation tends to erode purchasing power, disinflation – a slowdown in the rate of price increases – presents a different set of challenges, particularly for companies seeking financing. As disinflation alters market dynamics, it can have positive and negative repercussions for businesses. Understanding these implications is crucial for navigating the intricacies of corporate finance and strategizing for sustainable growth.

    Disinflation, often misconstrued as deflation, represents a decline in the rate of inflation, resulting in lower price increases for goods and services. This phenomenon, though seemingly favorable for consumers due to the increased purchasing power, can pose tricky challenges for businesses reliant on borrowing and investing for expansion and innovation. Deflation, on the other hand, is a negative inflation rate such as the one the U.S. experienced at the end of the Global Financial Crisis in 2009.

    Source: Aranca Research

    Disinflation’s Impact on Company Financing

    Many factors influence capital markets, such as technological advances, monetary policy, and regulatory changes. With this caveat in mind, history signals that debt and equity issuance expands after a period of disinflation.

    Impact on Borrowing Costs and Debt Servicing

    One of the primary implications of disinflation for companies lies in its effect on borrowing costs. With decreasing inflation rates, lenders may perceive reduced risks in lending, resulting in a potential decline in interest rates. While this might seem advantageous, the actual impact can be multifaceted. Companies relying heavily on fixed-rate debt might find themselves locked into higher interest rates, leading to increased debt servicing costs relative to the prevailing market rates. Furthermore, renegotiating existing debt terms could become a daunting task, potentially impacting the overall financial health of the company.

    As interest rates dipped and debt capital markets matured, issuing debt became cheaper and corporations seized this opportunity. Moreover, debt issuance was influenced by other factors, such as the maturity of the high-yield debt market and growth in non-bank lenders such as hedge funds and pension funds.

    Source: Bloomberg, Dealogic, Federal Reserve, SIFMA, Refinitiv

    Note: Data reflects U.S. debt issuance dollar volume; Interest Rate is the 10-year Treasury yield; as on June 20, 2023

    Impact on Equity Issuance and Investor Sentiment:

    Companies issued low levels of stock during the ‘80s disinflation period, but issuance later rose nearly 300% in 1983. Other factors also influenced equity issuance, such as macroeconomic expansion, productivity growth, and the dotcom boom of the ‘90s.

    Disinflation can considerably influence investor sentiment and consequently impact stock performance. Investors often gauge a company's performance relative to the prevailing economic conditions. In disinflationary environments, investors might perceive companies as having lower revenue growth potential, leading to decreased market confidence and a subsequent dip in stock prices. Maintaining investor trust and effectively communicating the company's strategic initiatives become paramount during such periods to mitigate the potential negative impact on stock performance.

    Source: Bloomberg, National Bureau of Economic Research

    Note: As on 1 December 2023

    Things to Consider During Disinflation:

    Amid uncertainty in financial markets, lenders and investors may be more cautious. Companies would need to be strategic about how they approach capital financing.

    • High-quality, profitable companies could be well positioned for IPOs as investors are increasingly emphasizing cash flow.
    • High-growth companies could face fewer options as lenders become more selective and could consider alternative forms of equity and private debt.
    • Companies with lower credit ratings could find debt more expensive as lenders charge higher rates to account for market volatility.

    As disinflation alters the dynamics of capital markets, companies might have to recalibrate their financing strategies and capital expenditure plans. The reduced cost of borrowing could present an opportune moment for strategic investments and expansions. However, companies must carefully assess the potential long-term impacts and align their investment decisions with evolving market trends and consumer preferences. Adapting to the changing landscape while ensuring a sustainable and resilient financial structure is imperative for long-term success.

    In conclusion, while disinflation may initially seem favorable for consumers, its implications for company financing can be far-reaching and complex. By understanding the nuanced interplay between borrowing costs, investor sentiments, and strategic financial management, companies can navigate the challenges posed by disinflation and position themselves for resilient and sustainable growth in a constantly evolving economic landscape.


  2. Tokenization: From Brick to Blockchain

    The real estate industry is swiftly adopting tokenization, and conventional real estate institutions are working with technology suppliers

      to read | words

    The real estate industry is swiftly adopting tokenization, and conventional real estate institutions are working with technology suppliers to investigate the tokenization of loan or equity. Increasing investor access to high-quality real estate assets is anticipated to revitalize real estate investment as more technology-driven real estate initiatives come to fruition.

    Investment Revolution: The Innovation of Real Estate Tokenization

    In the financial industry, tokenization is experiencing rapid growth, allowing investment through digital tokens backed by physical securities or assets. Blockchain technology is at the core of tokenization, a distributed ledger that secures identical data copies across an authorized stakeholder network.

    Tokenization leverages the immutable security features inherent in blockchain technology, facilitating digital fractional ownership with secure transaction records and expeditious settlement procedures. Traditionally, real estate has been characterized by low liquidity due to substantial capital requirements and protracted, costly transaction processes.

    Real Estate Investment Trusts (REITs) have proven to outperform other major asset classes over the long term, serving as a more liquid avenue to access the real estate market. Through the process of real estate tokenization, a real estate asset is divided into manageable pieces or tokens. Each of these tokens is represented as a digital token on a blockchain. This innovation facilitates investors to engage in the buying and selling of fractional ownership in real estate assets more seamlessly and profitably than was previously possible.

    How Real Estate Tokenization Works?

    Tokenization is an act of dividing a real estate property into digital tokens, each representing a portion of the original property. Tokenization makes real estate investing more affordable to a wider variety of potential buyers by dividing pricey properties into smaller, more inexpensive pieces.

    The foundation of the procedure is blockchain, which offers a transparent and safe medium for token transfers and storage. Additionally, smart contracts, which are self-executing agreements, define the terms of the transaction and initiate transfers on their own when predetermined criteria are satisfied. By streamlining transactions and removing the need for intermediaries, this mix of technologies improves overall process efficiency.

    Lifecycle of a Tokenized Security 

    Source: Aranca Research

    The lifecycle of a tokenized security can broadly be divided into five stages:

    • Deal Structuring: In the initial phase, the crucial factors include shareholder and asset categories, relevant jurisdiction, and applicable legislation. Before securing capital for a new venture, issuers often opt to tokenize previous transactions to enhance liquidity for existing investors.
    • Digitization: Information traditionally in paper form is uploaded to the blockchain and encoded into smart contracts to issue security tokens.
    • Investor Management: In the primary distribution phase, tokens are allocated to investors in exchange for capital, and investor details are recorded digitally.
    • Corporate Action Management: Post-tokenization involves managing corporate actions like dividends and shareholder voting, which can often be automated using token-based smart contracts. This management persists until the token matures or is redeemed.
    • Secondary Market Trading: The final stage, enhancing liquidity through tokenization, occurs in secondary trading, where token holders trade on exchanges or over-the-counter with other investors.

    Source: Aranca Research

    Returns from Real Estate Tokenization

    Investing $10 in a real estate token represents a one-millionth share in the underlying apartment building's value. Upon property sale, a proportional one-millionth (0.0001%) of the proceeds would be achieved. Potential earnings from tokenizing real estate can vary substantially and rely on multiple factors such as:

    • Rental Income: The revenue from real estate asset tokenization depends on rental income. Discrepancies in investment contracts, dictating the distribution of rental proceeds and property expenses, vary among tokenization platforms. After deducting expenses, token holders receive rental income proportional to their ownership stakes.
    • Capital Gains: The ROI resulting from real estate tokenization is contingent upon factors such as jurisdictional regulations and the extent of capital gain tax deductions applicable.
    • Dividend Payments: The determination of the profit-sharing payment schedule between the company and its investors constitutes an additional factor for consideration. The pricing per share is established by the board of directors of the real estate company, with variations evident across different companies.
    • Platform Fees: The trading or processing fees associated with the real estate tokenization platform significantly influences return on investment. Specifically, RealT retains just 2% of the gross rental income, with the remaining 98% being disbursed to RealToken holders in USDC.
    • Financing Costs: The financial arrangements associated with the property, particularly when secured through a mortgage, exert a consequential influence on the investment's net income, with interest rates and loan terms playing pivotal roles in shaping this outcome.

    Implication of Real Estate Tokenization

    In recent years, blockchain-based tokenized property, whether real or otherwise, has garnered significant attention. Tokenization brings clear benefits, reducing paperwork in property transactions through smart contracts, saving time, effort, and execution costs, while streamlining verification processes for enhanced efficiency.

    • Liquidity: Tokenization facilitates the safe exchange of shares among investors, allowing each transaction to be recorded on the digital record of ownership. The imminent globalization of liquidity in tokenized securities arises as regulatory frameworks worldwide increasingly embrace and establish guidelines for the oversight of digital securities exchanges.
    • Data Transparency: Blockchain's distributed ledger ensures data immutability and resistance to cyber-attacks. While transaction information remains trackable and visible, blockchain transactions maintain data anonymity through cryptographic hashes.
    • Taxation: In traditional real estate transactions, buyers receive a deed and physically inspect the property. In the tokenized realm, caution is crucial due to prevalent scams; investors must verify the token's legitimacy and its underlying real estate asset.
    • Tokenized Real Property Different from REITs: REITs were a way to democratize commercial real estate ownership. Tokenization is an extension to what REITs are and inclusive of any real estate, and not just commercial. Through tokenization, each property can be divided into fractional shares, enabling individuals to become fractional owners of any real estate asset. This innovation widens the investor base, fostering a more inclusive and democratic form of ownership.
    • Legal Implications: In traditional real estate transactions, a tangible deed verifies property ownership. Conversely, the tokenized realm harbors scams, necessitating vigilant investor scrutiny to ensure tokens authentically represent tangible real estate assets.

    Conclusion: The Road Ahead

    The real estate market is currently experiencing a significant transformation through the emergence of tokenization. Currently valued at approximately $200 million, real estate tokens constitute nearly 40% of the digital securities market, establishing themselves as an increasingly popular investment avenue. The potential trajectory of tokenized real estate holds promise, with the potential to revolutionize investment practices and trading dynamics in the real estate sector. Enhanced liquidity stands out as a primary benefit of tokenized real estate, as these tokens are transactable on a digital marketplace, enabling investors to seamlessly trade ownership stakes devoid of traditional intermediaries such as real estate agents or banks. This facet not only facilitates easier transactions but also broadens accessibility to real estate investment by allowing investors to acquire smaller ownership shares in a property.

    Tokenization of diverse real estate assets is expected to surge in future, encompassing residential and commercial properties, as well as real estate funds and REITs. However, it is imperative to acknowledge the existence of regulatory and legal challenges that necessitate resolution to ensure the execution of tokenization in a compliant and transparent manner.


  3. IFRS 17: A Move Toward Standardized Insurance Reporting

    After years of intensive discussions and overcoming major concerns of the insurance industry, the International Accounting Standards Board

      to read | words

    After years of intensive discussions and overcoming major concerns of the insurance industry, the International Accounting Standards Board (IASB) issued its new insurance contracts standard IFRS 17 (formerly known as IFRS 4 Phase II), effective for annual periods beginning on or after January 1, 2023. Insurance companies using IFRS standards started reporting as per the new standards in 1H23 and 9M23 with one year restated comparative information. Around 450 insurers are listed under IFRS, with an asset base of USD 13 trillion.

    IFRS 17 increases the simplicity and transparency of financial statements. Earlier, under IFRS 4, it was difficult to analyze insurance companies due to a lack of clarity regarding core insurance and investment results, unlike other industries where investment income is recognized after recording the cost of goods sold and operating expenses. The new standard removes this difficulty, making it easier for investors to analyze insurance companies. The main impact is on life insurance companies or the life segment of insurance companies, as IFRS 17 follows a more conservative framework than IFRS 4.

    Purpose behind the new accounting standard:

    • The objective of IFRS 17 is to provide a more simplified version of the income statement by clearly distinguishing net insurance results and investment results, enabling investors and analysts to compare insurance companies across different countries, industries, and contracts.
    • The new standard also provides a consistent framework of accounting for different insurance contracts, removing existing inconsistencies.

    Impact:

    • IFRS 17 will have a major impact on the life segment's revenues, especially life insurance contracts with an annuity. This is because the new standard follows a conservative accounting approach by recognizing expected profits when insurance services are provided and recognizing expected losses once discovered.
    • Considering the top life insurers in Europe in terms of asset base, restated revenues of 1H22 (June-2022) were lower by double-digit year-on-year (see appendix for more details).
    • In terms of equity for FY2022 (Dec-2022), Aegon Ltd and Swiss Life Holding reported a drop in low double-digits, while Allianz’s restated equity was lowered slightly.
    • The Property and Casualty segment will have less impact as the contract is short term (less than 1 year) and liability arises only when the insurance contract is claimed.
    • The new standards will change the presentation of financial statements and information. However, the fundamentals of the sector, business strategy, capital management approach, or outlook of insurance companies will remain unaffected.
    • The key point to highlight is that the impact will be clear a few quarters down the line when companies publish further quarterly reports.

    Rating implications:

    • S&P, Moody’s, and Fitch expect no rating action with the implementation of the new standard unless the risk structure or capitalization strategy of the respective insurance company is changed.

    Key changes:

    Rise in Life & Health liabilities and profit recognition results in significant initial drop in equity:

      Source: Insurance company’s website, Aranca research

    1. Shareholder’s equity will reduce as the deposit amount received from policyholders (particularly from annuity contracts) was recorded in equity via retained earnings (as per IFRS 4). As per IFRS 17, this deposit will be recorded as a contractual service margin (CSM) and will be released as the insurance service is provided.
    2. IFRS 17 is based on the concept that profit is recognized only when the associated service is provided. Consequently, unearned profit for insurance services — CSM — is presented as part of the insurance contract liability on the insurer’s balance sheet.
    3. The risk adjustment (RA) is a simple concept that reflects the uncertainties around the value of future cash flows. It is a non-financial measure associated with fulfilling contractual liabilities; for example, issues with policyholders, and environmental or regulatory changes.
    4. The best estimate liabilities (BEL) represent the present value of future liability due to insurance contracts; for example, directly attributable claims expenses.

    More simplified income statement, clearly distinguishing net insurance and investment income:

    Source: Insurance company’s website, Aranca research

    1. Insurance revenue will be lower than IFRS 4 as it will reflect the amortization of CSM over the term of the contract (only for life insurance) as insurance services are provided.
    2. Insurance service expenses include claims expenses.
    3. Insurance service results provide net underwriting results, making it easier for investors to compare insurance companies.
    4. Investment income is recorded after the insurance service result (underwriting result), making the accounting practice in line with other financial sectors like banking and investment management.

    Illustrative revenue recognition for life annuity contracts:

    Source: Aranca research

    • The graph above illustrates the impact on the life insurance segment’s revenues due to change in time of revenue recognition as per the IFRS 17 standards.
    • Under IFRS 4, there was significant recognition of day one profit to the income statement. As a result, writing of a new annuity business has been beneficial from an earnings perspective. However, there was much smaller ongoing profit recognition over the remaining life of the product. 
    • Under IFRS 17, driven by the inclusion of CSM, there is no day one profit recognition, rather it is amortized over the period of the contract. IFRS 17 will result in higher ongoing profits than IFRS 4 (in exchange for no day one profit), with the ultimate economics being unchanged.

    Rating agency views:

    S&P:

    • The accounting change is, by itself, unlikely to trigger rating actions. That said, if insurers change their risk appetite or capitalization strategy following the introduction of IFRS 17, it could lead to rating actions.
    • Preparing for the new standard has, at times, been arduous, but S&P Global Ratings anticipates that the improved transparency will be worth it.
    • IFRS 17 should make it easier to identify and compare how insurers and reinsurers generate profits and handle risks.

    Moody’s:

    • Moody’s does not expect the application of the new accounting standards to directly affect the underlying economic risk or expected cash flows of in-force business.
    • It adds that the new standards do not directly affect regulatory financial reporting and regulatory capital for most regulatory jurisdictions. However, it will affect the presentation of financial statements, including revenue, net income, equity, and insurance liability.

    Fitch:

    • IFRS 17 is an improvement on IFRS 4, making financial statements more transparent despite the initial imperfections.
    • Fitch expects IFRS 17 results to become more (but not fully) comparable over the next two years, with insurers, analysts, and investors gradually developing enough confidence in the new accounting standard to use it as a basis for decision-making.
    • In the meantime, Fitch does not expect IFRS 17 to significantly affect insurers’ business models or their credit ratings.

    Appendix:

    The table below showcases comparison between IFRS 4 revenue and IFRS 17 revenue for selected top life insurance companies (in terms of asset base) of Europe.

    Company Name (All figures in EUR mn unless stated)

    Country

    Total Assets

    Insurance revenue 1H22

    Insurance revenue 1H22 - restated

    Net profit 1H22

    Net profit 1H22 - restated

    % change revenue

    % change net profit

    AXA SA

    France

    696,697

    53,687

    40,896

    4,207

    3,925

    -23.80%

    -6.70%

    Assicurazioni Generali
    S.p.A.

    Italy

    519,051

    38,103

    22,593

    1,577

    1,085

    -40.70%

    -31.20%

    Credit Agricole Assurances S.A.

    France

    409,389

    19,026

    6,506

    780

    471

    -65.80%

    -39.60%

    Aegon Ltd.

    Netherlands

    400,936

    7,532

    5,506

    64

    46

    -26.90%

    -28.10%

    Allianz Lebensversicherungs-AG

    Germany

    286,576

    41,128

    42,055

    2,479

    2,675

    2.30%

    7.90%

    Swiss Life Holding AG

    Switzerland

    220,954

    7,918

    3,721

    642

    710

    -53.00%

    10.60%

    NN Group N.V. 

    Netherlands

    217,110

    7,636

    5,154

    2,013

    1,727

    -32.50%

    -14.20%

    Intesa Sanpaolo Vita S.p.A 

    Italy

    148,275

    4,674

    1,491

    440

    427

    -68.10%

    -3.00%

    Average


    -38.60%

    -13.00%

    Source: S&P Capital IQ, Aranca research


  4. USMCA - A Three-Year Retrospective and its impact

    The US–Mexico–Canada Agreement (USMCA), implemented in 2020, replaced North American Free Trade Agreement (NAFTA) and has significantly ben

      to read | words

    The US–Mexico–Canada Agreement (USMCA), implemented in 2020, replaced North American Free Trade Agreement (NAFTA) and has significantly benefitted North American trade. It led to a substantial surge in trade, with North American trade volume exceeding USD 1.5 trillion in 2022 led by double-digit growth in trade since 2022. This free trade environment created 9.5 million jobs, and the three countries now account for one-third of the world's GDP. Investments in the region posted remarkable growth, with capital investments increasing 134% to reach USD 219 billion. However, USMCA faces challenges, such as trade disputes, and public opinion on international trade has shifted with 66% of Americans now supporting restrictions on imported foreign goods. The agreement's future will depend on addressing these issues before the joint review in 2026. If successful, the agreement could boost trade relations, enhance digital trade, and promote economic growth in North America.

    USMCA: A Three-Year Retrospective and its Impact

    Introduction: The USMCA signed on November 30, 2018, and implemented on July 1, 2020, served as a much-needed revitalization of trade relations between the three countries involved. Its objective is to promote free trade among the participating nations and replace NAFTA, which was signed in January 1984. The USMCA successfully reformed and facilitated trade between the countries, resulting in increased job opportunities, investments, and boost in exports for all countries in North America. This comprehensive agreement introduced measures to enhance intellectual property rights, providing companies with greater security and fostering increased investments. Through streamlining trade regulations and promoting fair competition, the USMCA aims to create a prosperous and balanced trading environment for the US, Mexico, and Canada. Overall, the USMCA represents a significant step towards strengthening economic ties and promoting sustainable growth among these nations.

    Major Provision of the USMCA

    • Agriculture and Dairy: USMCA aimed to open the Canadian dairy market, allowing the US farmers access to Canadian dairy markets tariff-free for up to 3.6% of the total market value. This agreement also aimed to further improve the access of poultry products to the market.
    • Intellectual Property: The agreement extends copyright periods to 70 years beyond the creator's death and prohibited tariffs on digital products. It also creates a copyright safe harbor for internet companies.    
    • Automobiles: USMCA increased the minimum regional content requirement for duty-free cars and trucks to 75% (compared with 62.5% under NAFTA) and established minimum wages for automotive workers to at least $16 per hour.
    • Sunset Provision: Unlike NAFTA, the USMCA has a built-in expiration clause after 16 years. However, it can be renewed every six years through a joint review. The agreement is not automatically terminated if one party refuses to renew it. Instead, for the next ten years, the nations must meet annually to address any issues impeding renewal. The agreement will only expire if no agreement is reached during this period. The USMCA joint review is expected to be held in 2026. 

    USMCA: Three-Years Impact

    The USMCA trade agreement completed three years in July 2023 and has played a significant role to help mitigate supply chain risks, reduce dependence on China, aid in development of crucial industries and increase industrial competitiveness leading to creative destruction. After COVID-19, the US introduced policy measures to build a resilient supply chain with respect to key industries such as semiconductors, rare Earth metals and batteries. In the last three years, USMCA has been able to foster jobs, investments, and boost trade in North America. Following are some of these impacts:

    • Rising Trade: USMCA has improved North American trade, with a steep rise to USD 1.5 trillion in 2022. Free trade within the region created 9.5 million jobs, and the three countries accounted for a third of the world's GDP. In the last two years, Mexico and Canada became top US trading partners with 44% more volume than goods trade with China.

      Source: Banco de Mexico, Statistics Canada (2023), US Census Bureau

    • Increased Investments (FDI and intra-regional investments): USMCA led to an increased investments in the North American market. Capital investments in the region posted a sharp 134% rise after the implementation of USMCA and stood at USD 219 billion. The US was one of the largest receivers of these investments with over 11% of the FDI coming from Mexico and Canada. Inward FDI into Mexico was at USD 29.04 billion in 1Q23, out of which the North American Region accounted for nearly 46% of the total investments. Notably, the manufacturing sector's FDI share in the country more than doubled from 24% to 56.9%. During this time, nearly five out of every ten new dollars invested in Mexico came from Canada and the US. Similarly, nearly half of Canada's FDI in 2022 came from other USMCA countries. Furthermore, FDI inflows into Canada increased 23% between 2020 and 2022. From July 2020 to March 2023, the US invested nearly USD 31 billion in Canada, and USD 28 billion in Mexico. Canada, however, invested USD 17.7 billion in the US and USD 2.8 billion in Mexico. Mexico invested USD 0.1 billion in Canada and USD 2.8 billion in US.

    • Supply Chain Resilience: USMCA led to increased investments in key industries across North America. Rising investments in electric vehicles (EVs), semiconductors, emerging tech and infrastructure have given hope for a growing resilience of the supply chains. Over the next decade, key initiatives, such as the Bipartisan Infrastructure Bill, the CHIPS and Science Act, and the Inflation Reduction Act (IRA), are expected to attract approximately USD 3.5 trillion in investments. Canada also established a USD 1.5 billion Canadian Critical Minerals Infrastructure Fund and set aside nearly USD 4 billion for their 2022 Critical Minerals Strategy. Furthermore, the Canada–US Joint Action Plan on Critical Minerals announced in 2020 aims to support bilateral mineral trade worth more than USD 95.6 billion.

      Source: Brookings

      Challenges with USMCA:

      Despite the constant efforts to foster smooth trade between the trilateral, USMCA is facing several hurdles as increased trade protectionism becomes a trend worldwide. Since the USMCA came into effect, there have been disputes over Mexico's energy policies, automotive rules of origin, Mexico's ban on GMO corn, and Canada's implementation of its dairy market access commitments. The US has filed disputes over these matters, as well as labor rights and wages in Mexico. Some disputes have been resolved by USMCA panels, but others remain pending or ignored. This could affect the public support for USMCA among the three countries. A recent survey by the Chicago Council on Global Affairs in 2023 found that 75% of Americans believe that international trade is beneficial. This is lower than the 87% support in 2019, when the USMCA was being negotiated. Support for international trade is lowest among Republicans, at 63%. This suggests that there could be political turmoil if there is a change in the current administration. There is a growing call for protectionism in the US trade, with 66% of Americans believing that there should be restrictions on imported foreign goods. This is highest among Republicans (79%) and lowest among Democrats (61%). Public opinion of Mexico, the US's largest trading partner, has also fallen. Only 59% of Americans now have a favorable view of Mexico, down from 63% in 2022. Despite the conservative nature of the USMCA, the strong support for protectionism could lead to rising disputes between the US and its trading partners.

      Source: The Chicago Council on Global Affairs

    Conclusion:

    USMCA has gained importance due to geopolitical turmoil, including COVID-19, Russia–Ukraine war, and economic tensions with China. The public opinion remains largely positive, with over 80% of Americans supporting international trade. However, increased trade disputes among the member countries and rising political turmoil could put the agreement in an unfavorable position. If the agreement remains in favor for all three parties, during the “Joint Review” in 2026, it could boost trade relations leading to rise in digital trade, digital regulation for AI and build capacity through SMEs. USMCA may continue to increase trade within North America and help create better supply chains, which will aid businesses and lead to increased job creation and investments throughout the region.


  5. Biases and Investor Choices: A Behavioral Finance Perspective

    Behavioral finance is a fast-growing field that focuses on the complex interplay between human psychology, investor behavior, and

      to read | words

    Behavioral finance is a fast-growing field that focuses on the complex interplay between human psychology, investor behavior, and financial markets. By examining the impact of psychological elements on investor conduct, specialists in behavioral finance aim to explain why financial markets behave in a certain manner, and how investors can take better decisions A plethora of cognitive elements, including but not limited to overconfidence, confirmation bias, herd mentality, and loss aversion, can significantly influence investment decisions. Gaining insight into these biases can offer valuable perspectives on market trends and support investors in making decisions that are better informed.

    Have you ever wondered why some investors tend to make irrational choices, even when presented with rational information? Imagine the roller coaster of emotions an investor experiences, oscillating from the excitement of a bullish market to the anxiety of a downturn. While investors often assume their choices are rational and rooted in thorough analysis of available data, recent studies indicate that their actions are frequently affected by various cognitive biases and mental shortcuts, resulting in less-than-optimal decision-making. Behavioral finance, in particular,sheds light on these biases, which drive the emotional peaks and valleys that, in turn, shape investment choices.

    Source: Credit Suisse, Aranca Research

    From fear and greed to overconfidence and loss aversion, there are countless ways our brains can lead us astray when it comes to investing. The actions of many biased investors can influence market trends, leading to irrational exuberance or panic. Understanding psychological bias can help investors understand market behavior and make better investment decisions.

    • Overconfidence: One of the key psychological biases in investor behavior is overconfidence. According to a study by Barber and Odean (2000), overconfident investors tend to trade more frequently, leading to higher transaction costs and lower portfolio returns. For instance, during the dot-com bubble in the late 1990s, investors exhibited unjustified confidence in the potential of internet companies, resulting in inflated valuations and subsequent market crashes

      Source: “The Courage of Misguided Convictions” 1999, Financial Analysts Journal, Aranca Research


    • Confirmation Bias: Confirmation bias refers to the tendency of investors to seek out information that confirms their existing beliefs and opinions while disregarding contradictory evidence. This bias can lead to narrow focus on confirming one's investment decisions rather than objectively evaluating alternative viewpoints. For example, investors who are bullish on a particular stock may actively seek positive news and ignore negative developments, leading to distorted perceptions of the stock's value.

      Source: Aranca Research

    • Herd Mentality: Investors often exhibit herd mentality, relying on the actions and decisions of others as a signal for their own investment choices. This behavior stems from the concept of social proof, where individuals assume that the collective wisdom of the crowd is more dependable than their individual judgment. For example, the famous case of the 2008 financial crisis showcases herd behavior, as investors followed the crowd in investing heavily in mortgage-backed securities, underestimating the underlying risks.
    • Loss Aversion and Risk-Seeking Behavior: Loss aversion is the tendency of investors to feel the pain of losses more intensely than the excitement of gains. This bias often leads investors to take excessive risks to avoid losses or recover from them quickly. Research by Kahneman and Tversky (1979) shows that investors are typically twice as sensitive to losses as they are to gains. For instance, investors may hold onto losing positions in the hope of a rebound, leading to suboptimal portfolio diversification.

      Source: Nielsen Norman Group, Aranca Research

    • Experiential bias: Another pivotal psychological bias influencing investor behavior is experiential bias. In this case, investors' past encounters and memories can sway their decision-making, leading to choices that may not align with rationality. A notable illustration of experiential bias can be found in investors who, having weathered a severe market downturn, remain cautious about investing in stocks, even when confronted with solid data suggesting favorable conditions.
    • Disposition bias: Much like overconfidence, disposition bias plays a significant role in shaping investor actions. It explains why investors often hold onto declining stocks, convinced that they will eventually rebound, while simultaneously selling profitable stocks. This behavior can hinder overall portfolio performance.
    • Familiarity bias: Among the array of biases, familiarity bias is a potent force that guides investment choices. It is evident when investors opt for securities in industries, they are intimately familiar with, they tend to bypass opportunities in unrelated fields. This tendency can limit their exposure to innovative and potentially lucrative investment prospects.
    • Mental accounting: The concept of mental accounting reveals how people's spending habits and budgeting practices can fluctuate depending on circumstances. For instance, individuals may splurge on luxury items during a vacation or shopping spree but adopt a more conservative approach to spending when they return home. This shift in financial behavior exemplifies mental accounting's impact on decision-making.

    The world of finance is not just about numbers and data; it also highlights the influence of human behavior on financial decisions. As investors, we navigate through the turbulent waters of financial markets, sometimes oblivious to the subtle biases and cognitive shortcuts. Behavioral finance shines a spotlight on these imperfections in our decision-making processes and reminds us that our choices may not always align with rationality.

    These biases often shape our investment choices and landscape more than we realize and we would like to admit. Recognizing these biases is crucial for making rational investment decisions. While we cannot eliminate them entirely, understanding them empowers us to make more informed choices and strive to mitigate their impact.

    So, the next time you find yourself swept up in the excitement or fear of the financial markets, take a moment to reflect on the lessons of behavioral finance. Your portfolio could benefit greatly.


  6. The Current Real Estate Turmoil in China

    China’s real estate sector is in turmoil due to various factors, ranging from low investment to declining t

      to read | words

    China’s real estate sector is in turmoil due to various factors, ranging from low investment to declining trade numbers. It has far-reaching implications and is threatening the country’s economic growth. Therefore, the government has undertaken certain policy measures to limit the damages. However, a more extensive plan is needed to deal with this issue effectively.

    The chaos in China's real estate sector has destabilized the domestic economy. This crisis is marked by substantial losses experienced by major property developers, and REITs. China Evergrande Group posted combined losses totaling USD112 billion for the fiscal years 2021 and 2022. The debt crisis is escalating, with Country Garden, one of China's top five developers, perilously close to a bond default. It has projected USD6–7 billion for the first half of 2023.

    Factors such as diminished investments, weakening domestic demand, deflation worries, and unfavorable trade figures have been quoted as the reasons for the current situation. This has led to IMF revising down China’s GDP growth projection to 5.0% for 2023 and 4.2% for 2024, a 0.2% and 0.3% downward revision from earlier estimates. The negative state of China's real estate market will have far-reaching implications on various sectors and its overall economy.

    Declining Property Prices

    China has implemented the "three red lines" policy, outlining three precise balance sheet criteria that developers must adhere to if they intend to secure additional debt. These regulations mandate developers to restrict their debt relative to their company's cash flow, assets, and capital levels.

    However, this crackdown has dampened economic growth, given that the real estate sector contributes directly and indirectly to nearly one-third of the economic activity in the world's second-largest economy.

    Official data revealed that China's new home prices declined for the first time this year in July, dropping 0.2% month-on-month and 0.1% year-on-year, as calculated by Reuters based on data from the National Bureau of Statistics.

    Existing home prices are plummeting at least 15% in prime neighborhoods of major metropolitan areas like Shanghai and Shenzhen, as well as in more than half of China's tier-2 and tier-3 cities. Even areas near Alibaba Group Holding Ltd.'s headquarters in Hangzhou have seen a steep drop of approximately 25% from their late 2021 highs. While official home-price indexes suggest a less severe downturn, experts believe they may underestimate the true extent of the crisis due to outdated methodologies. Even top-tier cities like Shenzhen, once considered immune to housing market fluctuations, have experienced a 15% decline in existing home prices over the past three years.

    The challenge lies in lack of accurate data, as all sources in China face substantial obstacles in tracking home prices. According to Goldman Sachs China economists, there is no perfect gauge to assess the housing market.

    The discrepancy in home price perceptions is partly due to the diverse policy tools available to Chinese authorities. Unlike countries like Australia, Singapore, or the US, China can implement unique measures such as restricting home purchases for non-locals or imposing limits on property ownership. The uncertainty in housing price statistics further complicates policymaking efforts, potentially hindering the development of effective strategies to stabilize the market. As the housing market continues to fluctuate, finding the right balance between downward pressures and easing hopes remains a key challenge for China's policymakers.

    Some of the main reasons for the real estate crash are:

    1. COVID-19 Lockdown - The main reason for the decline in rates in the property market is the stringent lockdown measures imposed during the pandemic. These restrictions disrupted construction projects, causing delays and uncertainties in project completions. Consequently, potential buyers hesitated to invest, dampening overall demand in the sector. To make matters worse, some individuals, facing financial uncertainties, ceased paying EMIs as a form of protest or financial strain. This accumulation of unpaid EMIs is now posing a significant threat to the asset quality of banks, creating a challenging situation for both the real estate industry and the financial sector in China.
    2. Property Market Turmoil - China's property market remains ensnared in a crisis, with prominent developer Country Garden projecting a potential net loss of up to USD7.6 billion for the first half of 2023. This projection is indicative of a downtrend in the real estate market, contracting gross profit margins, and foreign exchange fluctuations. The situation is exemplified by Evergrande, the world's most indebted property developer, which recently revealed a combined loss of USD81 billion over two years (2021 and 2022).
    3. Investment Decline - Investment in the Chinese property market plummeted nearly 8% year-on-year in the first half of 2023. This sharp decline in property investment is worrisome, as the real estate sector accounts for a quarter of China's economy, making it a critical driver of economic growth.
    4. Youth Unemployment and Reduced Consumption - Youth unemployment has surged since January 2023, reaching an all-time high of 21.3% in June 2023, as reported by the National Bureau of Statistics of China. This is expected to reduce disposable income and subsequently lead to decreased consumption and demand for goods and services, further exacerbating the economic challenges.
    5. Trade Woes - In July 2023, Chinese exports faced a substantial setback, registering a notable 14.5% year-on-year decrease, marking the most pronounced decline in over three years. From January to July 2023, exports contracted 5%, illustrating diminishing foreign demand for Chinese products. Conversely, imports decreased 12.4% annually in July 2023, marking their fifth consecutive drop and reflecting diminishing domestic demand.

    Impact of the Real Estate Turmoil

    The repercussions of the real estate issue extend far beyond the property market alone. It has far-reaching implications across various sectors of the Chinese economy. Struggling property developers and waning consumer confidence are dampening the construction industry, leading to diminished demand for projects and subsequent job losses. Consequently, the banking sector is grappling with rising defaults and unpaid loans, intensifying credit risks and impacting overall financial stability.

    China's manufacturing and materials industries are also feeling the effects of the weakened real estate market. Disruptions in production and supply chains have cascading effects, leading to declining property values and reduced household wealth that has affected consumer spending and the retail sector.

    The declining demand is mirrored in pricing dynamics, with the economy’s ongoing battle with deflation. Consumer prices fell 0.3% in July 2023, the first such drop since February 2021, and the producer price index (PPI) fell 4.4%, extending its downtrend for 10 months. These deflationary indications underline massive economic deceleration, driven by factors such as a sluggish real estate sector, weak trade, and restrained domestic demand, intensifying concerns about potential stagnation.

    Policy Responses

    As of July 2023, China has continued its efforts to boost economic growth and provide support to the struggling property market. Measures include extending loans to developers and decreasing mortgage rates. However, these measures may not completely stabilize the economy considering the various challenges outlined above, underscoring the immediate need for comprehensive strategies to address broader issues.

    Forecast

    JPMorgan has revised its global forecast for corporate high-yield defaults in emerging markets upward, primarily due to escalating concerns of contagion within China's property sector, potentially stemming from a Country Garden default.

    In an August 15, note the US-based investment bank increased its 2023 global default forecast to 9.7% from 6%. Furthermore, it adjusted its forecast for Asia's high-yield default rate to 10%, up from 4.1%. However, this figure decreases significantly to just 1% when excluding China's property sector.

    JPMorgan anticipates that China's property market will contribute nearly 40% to all default cases in 2023, followed by 35% from Russian corporate entities and 12% from Brazilian issuers.

    Conclusion

    The turmoil in China's real estate sector has had profound implications for the nation's economy, ranging from declining property investments and youth unemployment to weakened consumer spending and deflation concerns. While the government has taken steps to mitigate the crisis, a comprehensive and multifaceted approach is needed to address the broader economic challenges facing China. The nation's economic prospects remain uncertain, and it will require careful planning and effective policies to navigate these turbulent waters.


  7. Reshoring in US: Need for Locally Resilient Supply Chains

    US companies are increasingly reshoring their operations from China in response to supply chain disruptions and global uncertainties.

      to read | words

    US companies are increasingly reshoring their operations from China in response to supply chain disruptions and global uncertainties. CEOs in the US are investing in emerging technologies to enhance productivity and gain a competitive edge. The reshoring movement aims to build locally resilient supply chains and mitigate future risks. By adopting reshoring, the US can strengthen its manufacturing sector, foster economic growth, and create sustainable jobs.

    Lately, the global business landscape has experienced a noticeable shift as US companies increasingly seek to bring their manufacturing operations back home. The ramifications of this paradigm shift in global manufacturing are notably evident within the US at present. Over the past year, the construction of new manufacturing facilities jumped 116%. Furthermore, on a national scale, the aggregate industrial space currently under construction exceeds 690 million square feet, representing a significant rise from the previous year's record of 592 million square feet.

    China, which has long been considered the manufacturing hub of the world, is seeing its reign over this industry slip. Moreover, Russia's invasion of Ukraine and ongoing repercussions of COVID continue to cause major disruptions on shipping operations. As a result, several companies are forced to reassess their sourcing strategies.

    Many CEOs in the US are embracing reshoring, along with investing in automation, digitization, and emerging technologies, to boost local resilience and gain a competitive advantage. The US is proactively advancing its initiatives to incent domestic manufacturing. The top industries adopting reshoring are electrical equipment, computer and electronics, chemicals, and transportation. Electric vehicle batteries were the most common products to be reshored in 2022.

    Companies utilizing reshoring include tech giant Apple, which is relocating an increasing number of manufacturing sites to the US (especially California), with the aim of diminishing its reliance on manufacturing in China. In fiscal year 2021, Apple released a comprehensive supplier list, revealing that 48 of its 180 suppliers had transferred certain operations to the US by September 2021. This strategic move reflects Apple's commitment to diversifying its production locations and expanding domestic manufacturing capacities.

    Why Reshoring?

    Reshoring offers numerous advantages to the US economy such as:

    • Balanced trade and budget deficit: Through reduced imports and increased exports, reshoring can effectively enhance the US trade balance while decreasing dependency on foreign borrowing.
    • Supportive legislation: Recent legislative measures, such as the Inflation Reduction Act and the CHIPS and Science Act, also encourage reshoring activities, as they drive domestic manufacturing of components used in electric vehicles, energy-efficient equipment, computer chips, and defense machinery.
    • US-China tension: The geopolitical tensions between the US and China have been growing for an extended period. The trade war in 2019 greatly intensified the strained relationship between the two nations. Moreover, the outbreak of COVID exacerbated existing logistical challenges, prompting US companies to consider the feasibility of relocating their supply chains away from China.
    • Reduction of unemployment: Reshoring aids in the creation of additional jobs in the manufacturing and associated sectors, leading to lower unemployment rates and improved financial well-being of workers. As per an industry report, in 2022, over 364,000 manufacturing jobs returned to the US, reflecting a substantial 53% increase from the previous year. Remarkably, about 1.6 million manufacturing jobs that had been outsourced since 2010 have been successfully reintegrated back into the US.
    • Skilled workforce: By investing in education, training, and apprenticeship programs, reshoring facilitates the development of a proficient and competitive workforce capable of supporting innovation and bolstering productivity.
    • Lower product cost: By accounting for all concealed expenses linked to offshoring and outsourcing, such as transportation, inventory, quality, and risk factors, reshoring can lower product prices for manufacturers and consumers alike.
    • Environmental and social benefits: By decreasing transportation distances and emissions, reshoring effectively conserves resources and mitigates climate change effects.

    How to ensure the success of reshoring activities:

    • Automation and Digitization – CEOs investing in reshoring are actively automating manufacturing processes and implementing enterprise-wide software to digitize their workflows. Automation not only cuts down labor costs but also improves productivity and product quality. By embracing emerging technologies such as machine learning and artificial intelligence, firms can gain valuable insights, optimize production, and enhance decision-making capabilities. This technology-driven approach enables businesses to remain competitive in the global market.
    • Technology in Manufacturing – Traditionally perceived as labor-intensive and low-tech, manufacturing now leverages cutting-edge technologies and innovative practices. By highlighting the convergence of technology and manufacturing, companies can attract investments, promote innovation, and attract a new generation of talent. This shift in perception would elevate the status of the manufacturing industry as well as contribute to economic growth and job creation.
    • Vocational Education – Students must be encouraged and supported to pursue vocational careers. Academic degrees are usually highly sought after, while vocational education remains undervalued. By promoting vocational education and offering robust training programs, businesses can bridge the skills gap and cultivate a skilled workforce capable of meeting the demands of advanced manufacturing. Collaborations between educational institutions and industry leaders are crucial to equip students with the requisite skills and knowledge for future manufacturing careers.
    • Public/Private Investment – Public-private partnership is essential for the success of reshoring. Advocacy groups, policymakers, and industry leaders must work together to drive much-needed investments in small- and mid-sized manufacturers. Government incentives, tax breaks, and grants can encourage businesses to reshore and invest in advanced technologies. Furthermore, fostering an environment conducive to innovation and R&D would attract investment and enable the growth of high-tech manufacturing sectors.

    Challenges

    Reshoring provides significant advantages, but it is not without challenges. Cost considerations are a primary concern, as offshore production often offers lower labor costs. Moreover, US manufacturers face the challenge of distinguishing themselves and augmenting the value of their products and services, as certain countries continue to offer reduced labor costs and relaxed regulatory environments for manufacturing.

    Shortage of manpower is another major hurdle. US manufacturers must allocate resources to education, training, and apprenticeship initiatives to create a talent pool.

    Reshoring in the US symbolizes a transformative shift in the global manufacturing landscape. As companies seek to build locally resilient supply chains, they invest heavily in automation, digitization, and emerging technologies. By adopting reshoring and incorporating advanced manufacturing practices, businesses can set themselves for long-term success. However, to fully realize the potential of reshoring, it is essential to advocate public-private cooperation, rebrand manufacturing as a tech-driven industry, and actively support vocational education. By addressing challenges and seizing opportunities, the US can establish itself as a manufacturing powerhouse, encouraging economic growth and creating sustainable jobs.


  8. US Economic Slowdown – An Opportunity for India?

    As the US economy edges toward recession, equity investors are seeking opportunities in other countries. The focus is

      to read | words

    As the US economy edges toward recession, equity investors are seeking opportunities in other countries. The focus is on emerging economies, specifically in Southeast Asia, and the main contenders are China and India. Both countries have positive and negative factors influencing investor decision. Which country would attract the bulk of the diverted investments is yet to be seen.

    The US economy has been witnessing a slowdown and a shift to recession starting in 2022. While it showed resilience against the Russia-Ukraine war and the lingering effect of COVID, several factors are pushing it toward recession in 2023.

    The start of the year saw a slew of layoffs by US tech companies, starting with Google. In January 2023, the tech giant gave the pink slip to almost 12,000 employees. Meta followed suit and laid off more than 11,000 staff, with more cuts to be announced. This follows closely on the heels of job cuts by Amazon and Microsoft in the preceding year. Despite this, the US job market has continued to be strong and inflation remains much higher than the Fed’s target of 2%. This has led to the Federal Reserve Bank imposing significant rate hikes, yet the stance on the ongoing battle against inflation is still uncertain.

    Recent events, such as the failures of Signature Bank and Silicon Valley Bank, as well as the rescues of First Republic Bank by JPMorgan and Credit Suisse by UBS, highlight the potential risk of financial contagion in the face of rapid interest rate increases. The current environment leaves many financial institutions exposed to vulnerability of default, as elevated interest rates erode the market value of their assets.

    Although the US debt ceiling deal has allayed concerns over a potential default, there are still challenges ahead. The Treasury would have to issue a substantial amount of new bonds to replenish its cash balance at the Federal Reserve. This alone would drain about USD500 billion in liquidity from the market in the upcoming months, leading to a continued surge in yields in the near term. Coupled with the Federal Reserve’s quantitative tightening policy, these factors are likely to be a drag on the economy.

    As the struggle to achieve economic stability persists, equity investors are becoming increasingly cautious about further investing in the US. Their attention is now shifting towards the emerging economies that have better prospects. Among these contenders, China and India stand out as two formidable candidates.

    The story of China

    China’s economy is on the rebound and is expected to grow 5.2% this year. The country finally relaxed its zero COVID policy and removed the various restrictions on its citizens' movements. As mobility and activity pick up, the country expects increased spending and a boost to its economy. The growth estimates are highly promising, with China expected to contribute approximately one-third of the global economic growth in 2023.

    There are significant challenges as well, and the contraction in the real estate segment remains a major headwind. While China has enjoyed monopoly status as a manufacturing hub for many global companies, it is now losing this standing due to the following reasons:

    • An aging population has led to slow productivity growth.
    • The pandemic forced many global companies to re-evaluate their over dependency on China for their supply chain. Several players have pulled out their hubs and established alternative channels in other locations.
    • Its deteriorating relationship with the US and increasing alignment with Russia have led to many US companies moving out of China.
    • The US has stopped Chinese tech companies from operating in the country and has also banned their stocks.
    • Another major concern pertains to the ongoing devaluation of the Chinese yuan in relation to the US dollar. The yuan has surpassed the critical threshold of 7 against the dollar, signifying considerable depreciation.

    China has recently announced a series of policy decisions aimed at shoring up economic growth, including increased spending on infrastructure and support for SMEs. These measures come amid concerns over a potential slowdown in the Chinese economy, fueled by a combination of factors including rising debt levels, slowing population growth, and trade tensions with the US. While many analysts are in favor of these policy decisions, the market's view on whether they will be enough to sustain economic growth remains mixed. Some experts believe the measures would be effective in boosting short-term growth but may not be enough to address more fundamental challenges facing the Chinese economy. Others argue that the policies represent a positive step toward reforming China's economic model and could lead to more sustainable growth over the long term. Ultimately, the success of China's recent policy decisions would depend on various factors, including implementation, effectiveness, and the ability to navigate a rapidly changing global economic landscape.

    Therefore, while its overall growth rate is positive, investors may remain wary of investing heavily in the country.

    The rise of India as a strong opponent

    The other South Asian country that is a strong contender to China is India. As per the IMF’s projection India’s growth rate is 5.9% in 2023.

    India's growth trajectory over the past decade has been truly remarkable. While the global economy grapples with sluggish growth, soaring inflation, supply chain disruption, and an unprecedented level of debt, India has emerged as the fastest-growing major economy. This exceptional growth can be attributed to a mix of judicious government policies, economic reforms, and the presence of a vast, youthful, and diverse population.

    One key factor bolstering India's economic expansion is the upswing in domestic private consumption, which has provided a considerable impetus to manufacturing output across the nation. Furthermore, the government's proactive endeavors to improve infrastructure, digitize various public platforms to ensure convenient accessibility, and implement groundbreaking economic reforms such as production-linked incentive schemes have substantially contributed to India's economic advancement.

    Many international businesses and fund managers have already initiated investments in India. Its economic prospects could be written more tactfully without appearing one-sided in favor of India. While India can benefit from “friend shoring” and long-term favorable factors, there are certain challenges.

    One of the key challenges facing India is inflation, which has been on the rise in recent years and has the potential to dampen investor confidence. In addition, high current and fiscal deficit, along with a weak currency, have made India less attractive to foreign investors. Other challenges include a complex regulatory environment, inadequate infrastructure, and persistent issues with corruption and bureaucracy.

    In spite of these challenges, there are signs of progress, as the Indian government has taken steps to address these issues and create a more business-friendly environment. Recent reforms in areas such as taxation, labor laws, and ease of doing business have been well received by investors, and there is a growing sense of optimism about India's potential as a major economic player. In order to become the first choice for investors, India must continue to tackle these challenges and build on its strengths.

    Conclusion

    India has the potential to grow 7% if it is able to attract the right investments and make itself a preferred choice for foreign investors.

    The country stands poised to reap substantial benefits from a range of pivotal initiatives in the foreseeable future. These initiatives encompass the global offshoring trend, burgeoning domestic consumption, gradual relocation of manufacturing from China, digitization drive, and rising services exports.

    India's propitious business environment, coupled with its extensive reserve of skilled labor and abundant availability of raw materials, positions it as an enticing destination for companies seeking to transition their operations from China. Moreover, India's expanding digital infrastructure and flourishing services exports are anticipated to propel economic growth, offering lucrative investment prospects in the technology and services sectors.

    With these advantageous factors in place, India is well-equipped to capitalize on the prevailing themes and establish itself as a prominent player on the global economic stage, fostering a prosperous future for the nation and its stakeholders.


  9. Virtual Estate - An Illusion?

    Metaverse is a next-generation system that delivers content and services, probably why it is referred to as the

      to read | words

    Metaverse is a next-generation system that delivers content and services, probably why it is referred to as the evolution of the internet. Just as radio served as a platform for music and audio content, metaverse will be the foundation for web browsers with organized data and information on web pages and platforms.

    Metaverse is a shared, immersive, and "always on" layer of reality added to the form of a spatial internet.

    Source: Bloomberg: World Bank Commodity Prices

    Virtual worlds like Decentraland and The Sandbox, which can presently be accessed online, are places that deliver this new generation of information and services. These virtual worlds can be simply described as "websites you can walk through." Similar to computer games, such as The Sims and World of Warcraft, one can collaborate with others to complete chores, consume content, make purchases, and more.

    One can observe and interact with services and content in the actual environment through augmented reality-based projects such as OVER and SuperWorld. Imagine Pokemon GO, but with smart glasses that seem like regular spectacles that are in fact smart. Hand motions, vocal instructions, and controls on the glasses will be used to communicate with them. Your current smartphone apps and content will be transferred and put front and centre in your range of vision.

    They'll make activities like dining out, banking, choosing a restaurant, ordering a taxi, and socializing easier and more intimate parts of our daily lives.

    What is metaverse real estate?

    Real estate in the metaverse is constructed of pixels and is for sale. It is a non-fungible token (NFT) that gives the possessor digital proof of ownership over real estate on a metaverse platform. The procedure is quite identical to purchasing actual property.

    Numerous metaverses are available to browse, for example, Decentraland or The Sandbox. Even companies like Google and Microsoft are seeking to build their territories in metaverse. It might be worth millions of dollars depending on where your home is located. In actual currency. For example, popular locations like the Decentraland fashion district. In most circumstances, the land may be used to produce scenarios conducive to marketing, socializing, entertainment, and more. These aspects, as well as general market attitude, collectability, and platform popularity, affect the value of each plot of land.

    How does land derive value if it exists virtually?

    Although the internet may be infinite, a metaverse is not.  Multiple virtual worlds can exist, however, they will be limited in size. Hence, only a limited amount of land exists in every world, and it is designed such that more land cannot be added later. The rarity contributes to the appreciation in value.

    How to build real estate in the metaverse?

    Source: Aranca

    STEP 1 – Decide on a platform: Creating real estate in the metaverse calls for various abilities. All major blockchain platforms, including Ethereum, Polygon, Algor, and Solana, provide the framework for creating a democratic and community-driven virtual environment. A platform must be chosen primarily to create a metaverse.

    STEP 2 -Make a metaverse smart contract: Smart contracts are the cornerstone for properly harnessing the benefits of a virtual real estate metaverse ecosystem. Using an NFT smart contract, one can tokenize real estate assets into nonfungible entities.

    STEP 3 – Meta space designing as per requirement: Meta spaces include apps, virtual conference rooms, virtual meeting rooms, and virtual home theatres. Meta space is a virtual setting that a user with a VR headset can access. After the platform is built, ideas for the metaverse real estate property begin to emerge. It comprises creating the architecture of the building.

    Step 4 - Build a layer for interaction: This layer governs accessibility, navigation, communication protocols, and user controls. An easy illustration is when a user uses an entry pass to enter the main gate of a real estate establishment, like an event hall. Specifying the integration with external apps is necessary at this layer.

    Step 5 - Build an interoperability layer:  Interoperability broadens the scope of the metaverse and raises involvement. If you want to build a completely functional virtual world, you must encourage cross-environment transactions. Choose a blockchain that enables speedy and secure payment gateway transactions as a result.

    Source: Aranca

    Following are some top metaverse real estate websites:

    • The Sandbox – Properties on the Sandbox are identified as LAND, and you can find them on Sandbox's platform or buy them on some NFT exchanges operated by other parties, such as OpenSea and Rarible. Remember that in formal sales, NFT exchanges have typically been more expensive than LAND.
    • Decentraland - Plots of land have consistently ranked at the top of the list of most costly sales in existing metaverses. Decentraland's celebrity and influencer tenants, as well as high profile corporate collaborations, significantly contribute to the platform's attraction.
    • CryptoVoxels – With only 3,026 parcels at its beginning, this digital universe is one of the tiniest. These can be purchased through primary sales or through OpenSea, accepting USD and ETH as payment. Contrary to previous metaverses, CryptoVoxels has continued to grow and now has 7351 parcels. A land parcel is presently available for as little as 1.899 ETH, or about $5,335 USD.
    • Somnium Space – This metaverse first appeared in 2018 and is well-known for its games and NFT artwork. It heavily emphasizes virtual reality offerings. There were 5,000 parcels of unevenly divided land in the platform in the start of 2022. However, more acreage should become available in the future. Plots of land can be easily obtained on OpenSea, and $CUBE is the local money in Somnium Space.

    Sales volume of virtual plots of land in the metaverse:

    Source: Catella Research, 2022, Statista, nonfungible.com, Kate3155, stock.adobe.com

    KEY HIGHLIGHTS (As on Q3 2022):

    • The market cap of the virtual real estate market is $1.5Bn, which is at its lowest point in 2022.
    • Virtual real estate accounts for approximately 14% of NFT trading volume.
    • Somnium Space is the only world whose land appreciated in price in Q3 2022.
    • Most land holders either hold land for less than 7 days or more than 6 months.
    • The price of land in NFT worlds dropped 80% after Minecraft announced intentions to block NFTs and blockchain integration.

    Metaverse Real Estate Market 20222028

    Source: Brand Essence Research

    According to Brandessence market study, Metaverse real estate market is projected to record a CAGR of 31.2% from 2022 to 2028. The expanding popularity of NFTs in the metaverse environment and rising popularity of metaverse real estate globally are main drivers propelling the expansion of the global metaverse real estate market.

    Conclusion:

    Any investment carries risks and benefits, like any other newly developed technology. While many people may find the idea of metaverse land (and the absence of physical commodities) to be perplexing, there is little doubt about the potential of virtual reality, augmented reality, and artificial intelligence as well as related technologies.

    The third quarter of 2022 saw a sharp decline in trade volume has shown what many predicted for months—that the crypto market is currently experiencing a winter. The previous crypto winter ran roughly from January 2018 to December 2020. The acceptance of the metaverse as a whole, rather than just the cryptocurrency markets, has an impact on virtual real estate as an asset class. Although metaverse is still a young and emerging idea, it could be the driving force behind virtual real estate surviving this crypto winter.

    Despite most land prices falling, focusing on proposals that are still developing and providing utility to their consumers is crucial. These are the worlds that will last, and their lands will eventually appreciate in value.

    As investors prepare for a global recession, trading volume in virtual real estate, an asset class impacted by cryptocurrency markets and general metaverse adoption, has fallen sharply in Q3 2022.


  10. The Future of Internal Combustion Engine

    In 2021, the worldwide internal combustion engine (ICE) market was approximately worth USD 58,514.15 billion and is predicted to reach

      to read | words

    In 2021, the worldwide internal combustion engine (ICE) market was approximately worth USD 58,514.15 billion and is predicted to reach USD 93,615.18 billion by 2029, growing at a CAGR of 6.05% between 2022 and 2029 showing tremendous growth. It is likely to expand further as demand for passenger and commercial vehicles rise in both established and emerging markets. Electric powertrains are increasingly coupled with ICE to enhance vehicle fuel efficiency, which is driving industry development. The demand for ICE is growing exponentially in industries such as agriculture, construction, mining, and power generation. The global lack of EV infrastructure availability is partly responsible for the ICE market's growth.

    IC engines have long been popular. However, rising crude oil prices, severe emission standards, fuel supply security, and noise pollution have prompted OEMs to shift their attention toward natural gas and hydrogen-based engines.

    Increase in greenhouse gas emissions due to use of ICEV (Internal combustion engine vehicle)

    The greenhouse gas emissions (GHG) associated with vehicles using fossil fuels is higher than that of an electric vehicle, even during its manufacturing. Generally, carbon pollution is produced more while manufacturing a typical electric vehicle than making a gasoline car. Although greenhouse gas emissions from EV production and disposal are greater, overall greenhouse gas emissions from EVs are still lower than those from gasoline-powered vehicles.


    Recycling EV batteries reduces the demand for new materials and emissions during EV manufacture. EV battery recycling research continues despite the obstacles.

    Trends across major markets (China, Europe, India, and the United States)

    Battery Electric Vehicle (BEV) life-cycle emissions are lower by 19%-34% in India, 37%-45% in China, 66%-69% in Europe, 60%-68% in the US than that of Internal Combustion engine. In 2030, BEVs and ICE will have a life-cycle emission gap of 74%-77% in Europe, 62%-76% in the US, 48%-64% in China, and 30%-56% in India. Renewable energy BEVs have 81% fewer life-cycle emissions than internal combustion engines. Fuel cell electric vehicle (FCEVs) fueled by hydrogen created by reforming methane from natural gas have 26-40% lower life-cycle emissions than internal combustion engines registered in 2021, but if they use hydrogen produced from renewable energy, they have 76-80% fewer emissions.

    Government is dedicated to fully phase out new internal combustion engine (ICE)

    A growing number of national and sub-national governments have pledged to eliminate the sale or registration of new light-duty ICE vehicles. Sixteen national and sub-national governments agreed to phase out new ICE automobile sales and registrations between 2025 and 2040. Out of which, eleven of the sixteen countries target to phase out vans/light vehicles.

    Government with official targets to fully phase out sales/registrations of new light-duty ICE vehicles by a certain date* 


    Figure 1. Government intends to completely eradicate the sale/registration of new ICE vehicles as of September 2021. This map does not prejudge any territory's status, sovereignty, international borders, or name.

    Figure 1 shows the targets of 10 European nations, Canada, Costa Rica, Cape Verde, Singapore, and the U.S. states of California and New York. Canada lowered its 2040 target to 2035 on June 2021. Austria's Mobility Master Plan 2030 targets the 2030 goal in mid-July 2021. In early September, New York's governor approved legislation mandating emission-free new passenger vehicle and truck sales by 2035.

    Based on an estimated 66 million vehicles sold, the government of countries listed in the map represent 14% of all new passenger vehicle sales globally in 2020.

    Gamification generates reliable data of each customer allowing brands to personalize their shopping experience and customize offerings, leading to happy customers. This involves simplifying the shopping process and steps and designing enjoyable browsing sessions. Therefore, customer lifecycle is increased and can be made more profitable by upselling to them.


    Source: ACEA, Focus2Move, OICA, National Statistical Office Malta, MarkLines, California Auto Outlook, AAF, ALADDA

    Figure 2. 2020 worldwide new passenger vehicle sales/registrations determine box size in the above table. Governments with stated objectives to completely phase out new ICE automobile sales/registration are highlighted in blue and red. 

    Market share of new passenger cars globally in 2020 (country-wise)

    Countries Global market share
    France, UK, and California 2.5% 

    Canada

    2.3%

    Spain,New York

    1.3%

    Ireland, Netherlands, Cape Verde, Denmark,
    Iceland, Norway, Singapore, Slovenia, Austria and Costa Rica

    0.001%-0.5%

    China accounted for 31% of new worldwide automobile sales in 2020, with the US (excl. California & New York) accounting for 18%, Japan accounting for 6%, and Germany and India accounting for around 4% of global new car sales in 2020.

    Initiatives taken by key players

    In November 2021, six automakers (Ford, General Motors, Jaguar/Land Rover, Daimler, Volvo, BYD) pledged to phase out sales of new ICE cars and vans by 2040 worldwide and by 2035 in “leading markets”. General Motors will pivot to battery-powered vehicles by 2035, Mercedes has a target to sell only zero-emission vehicles by 2040, Volvo expects its car lineup to be fully electric by 2030, Ford has introduced an electric F-150 pickup truck and expects 40% of its global vehicle mix to be electric by 2030. BYD, a Chinese automaker, which is selling electric cars in Europe and Jaguar Land rover has also signed the pledge. Toyota, Volkswagen, and the Renault-Nissan-Mitsubishi did not sign the pledge due to challenges in shifting to zero emissions.

    Demand for Electric Vehicles is increasing

    As of June 2022, every car company is chip supply constrained when the M-o-M car sales were down owing to the supply constraints in the industry and not because of the demand. One-third of inflation can be attributed to the new unused car vehicle pricing because of supply constraints. As per the statistics, 45% of consumers intend to buy a car, increased by 12% points from the 2020 study. Out of that, 52% of car buyers prefer an electric vehicle which includes fully electric, plug-in hybrid and hybrid powertrains. The preference for fully electric cars increased from 7% in 2020 to 20% in 2022.


    2021 saw a rise in the sales and introduction of new electric car models

    Models of electric vehicles are available in selected developing regions by category (left), with sales and models accessible by area from 2016 to 2021. (right)


    Prices remain expensive and model availability is limited.

    In developing markets, there aren't many EV models available. Only 90 unique models were offered in 2021 throughout more than 50 country UNEP’s Global E-Mobility Program participants. Throughout emerging Asian markets, there were less than 40 models accessible, while fewer than 20 were available in all of Africa. There were 75 models available in Latin America and the Caribbean, which is somewhat more than there are in the US but significantly lesser than in China and Europe.

    In emerging markets, it is more common for the bigger or more costly versions to be offered. Despite significant differences in purchasing power, big vehicles and SUVs made up two-thirds of the models offered across the GEF programmed nations in 2021, which is comparable to Europe and the US. The most popular EV model in India was Tata's Nexon BEV SUV, which accounted for two-thirds of all EV sales. Most other options were also SUVs. In South Africa, luxury brands account for three-quarters of the electric vehicle possibilities. Similar findings may be made about emerging and developing economies generally.

    Prior to automakers being able to provide less expensive, mass-market choices, high-end vehicles also predominated key EV markets for many years, including those in China, Europe, and the United States.

    Even though a few tiny electric car models are already accessible, the costs are still prohibitive for customers in emerging markets. As a result, only a small portion of customers from high income categories can afford EVs, which restricts their adoption on a wide scale. Slower market adoption in emerging nations is also partly a result of a lack of widely available charging infrastructure and a lackluster regulatory effort.

    Conclusion

    ICE will survive for a longer period i.e., 2040-2050 than forecasted period of 2030-2040. The Electric vehicle growth is more dependent on supply chain growth than production capacity or demand given the fact that the Governments are supporting investment in supply chains. Internal combustion Engine is currently undervalued because it has a longer life, low capex as well as large free cash flow. Going ahead, significant competition in the Electric vehicle space will be coming as an investment of USD 515 Billion is expected to come until 2025.


  11. Shrinkflation in the US

    Shrinkflation is a form of inflation where companies reduce the product size, quantity, or quality to maintain or

      to read | words

    Shrinkflation is a form of inflation where companies reduce the product size, quantity, or quality to maintain or increase their profit margins. A common practice during high inflationary periods, shrinkflation is preferred when companies are hesitant to raise product prices amid rising operating costs. To avoid facing consumer backlash, companies sneakily practice shrinkflation, which, coupled with consumer ignorance, makes it hard to detect. Consequently, consumers may end up purchasing two packets of a product, for example, if its size is reduced by fourth. Thus, shrinkflation may not only help in maintaining margins but also boost sales. When accused of shrinkflation, companies may give several reasons such as health, environment, and better value addition. Inflation is transparent, but shrinkflation is underhanded and thus could be difficult to calculate and tackle.

    Introduction

    Inflation has been steadily rising across most developed economies, reaching decade-high levels in countries such as the US and UK. However, firms that raise product prices may face backlash from consumers and be accused of profiteering. Consumer confidence also slumps during periods of high inflation. Shrinkflation, also known as product downsizing, is a stealthy form of inflation where companies reduce the product's quantity or size instead of increasing its price. Sometimes, the product's quality is compromised while the original quality is sold at a higher cost. Firms downsize due to rising operating costs or in order to sustain margins without giving the impression of price hikes. Furthermore, firms actively try to hide downsizing fearing repercussions from consumers. As a result, many buyers do not notice shrinkflation and may even purchase more than they require.


    US Consumer Confidence Inversely Related to Inflation


    Source: Bloomberg

    Reasons for Shrinkflation

    • Higher manufacturing costs: Higher manufacturing costs are a primary reason for shrinkflation. Companies counteract higher costs for producing the same product without price hikes by selling smaller quantities at the same price; this also ensures their profit margins are sustained.
    • Inability to pass rising costs to customers: Some companies are unable to pass on the rising costs to customers without leading to a drastic fall in sales. Products with several close substitutes have high price elasticity and face this issue.

    Consumer Psychology

    Some think of shrinkflation as a cost-cutting strategy adopted by companies, but this presents an incomplete picture of the concept. To understand the market strategy behind shrinkflation and consumer psychology, it is crucial to learn about the price pack architecture, consumer buying behavior, and pricing and packaging strategies undertaken by various companies.

    Price Pack Architecture: A price pack architecture involves optimizing product variations to enhance margins and increase category share. For instance, for a specific product, in terms of pack size selection, price sensitivity, and channel preference, immediate purchase or consumption would be quite different from the stock-up purchase made towards the beginning of the month. The price purchase architecture serves as an analytical technique that permits companies and brands to ensure they can offer products that meet consumer needs and preferences at a price they are willing to pay in order to satisfy those needs. Using the price pack architecture, a brand constantly changes packages by decreasing or adding items from its product line. One successful example of price pack innovation in the US was PepsiCo's smaller cans. In 2013, PepsiCo offered its beverage in smaller cans, which allowed consumers to indulge in carbonated beverage with lower sugar and calorie intake.

    Consumer Buying Behavior: Consumers may not notice the effects of shrinkflation at first as there is a marginal decrease in quantity; however, they pay the same price for lower quantity. Shrinkflation is a hard reality for consumers already struggling with inflation. As much as consumers dislike inflation, they are against shrinkflation. Inflation can be transparent and consumers are aware of fluctuating prices, but they do not prefer purchasing two packets when one was sufficient to satisfy their needs earlier.

    Pricing and Packaging Strategies: Another factor influencing consumer psychology during shrinkflation is packaging. From chips to yogurt, and coffee to toilet paper, manufacturers worldwide are gradually shrinking package sizes while keeping the prices intact. In the US, Domino's Pizza decreased the size of its 10-piece chicken wings to eight without changing the prices, and Gatorade replaced its 32-ounce bottles with 28-ounce ones. Consumers may not notice these minuscule changes but brands profit from them.

    Case Studies


    The infographic shown above is a pictorial depiction of what happens in a shrinkflationary environment. In an inflationary environment, a 100 ml product costing USD10 would be sold for USD11 without any change in quantity. However, shrinkflation would cause a reduction in quantity to 80 ml without any price change.

    Toilet Paper: Earlier, 1,000 sheet toilet paper rolls were standard, which made it easier to compare. However, due to inflation, companies have reduced package sizes in two ways:

    • Reducing number of sheets: Companies have decreased the number of sheets. A Charmin roll, which used to have 650 sheets, is now charged extra for Mega Rolls, which have fewer sheets. Such reductions make comparison more difficult.
    • Shrinking toilet paper size: Many companies shrink the size of the sheets. Some have reduced the size from 4.5 inches to 4 inches, down 11.1%. Charmin has also decreased the size of its toilet paper.

    Cereal: Cereal is another popular victim of shrinkflation. General Mills minimized the quantity in the family-size box of Cheerios from 19.3 ounces to 18.1 ounces but increased the box size; it applied the same strategy with Cocoa Puffs. The quantity in Lucky Charms, another cereal by General Mills, was lowered from 16 ounces to 14.9 ounces. However, the box size remained the same and was renamed to Large Size, giving the impression that the new box contained more cereal. General Mills responded to shrinkflation charges by claiming the larger box size benefited the environment and provided the best value to the consumer.

    Mondelez: Global snack giant Mondelez International, Inc., well-known for its iconic Cadbury chocolate bars, has shrunk the size of its Dairy Milk chocolate without any increase or decrease in price. In 2020, the corporation faced severe accusations of shrinkflation as the product size reduced while net revenue from the chocolate segment surged.

    Mondelez – Net Revenue from Chocolate Segment (USD Million)


    Source: Mondelēz International, Inc. SEC Filings

    Popular treats including Twirl, Crunchie, and Wispa bars saw a reduction in size. The companies state the size shrink was largely enforced to lower the calorie content in their chocolates, but the strategy may have been triggered by soaring inflation across the globe.


    Consumer Response to Shrinkflation

    While consumers are hyperalert to inflation, they are not very observant of shrinkflation. According to a survey conducted by Morning Consult on shrinkflation, around 54% of Americans have heard, seen, or read something about shrinkflation and around two-thirds of them (64%) are concerned about it. Moreover, if brands expect shrinkflation to go unnoticed, they may have to reassess their strategy as the survey shows that only a small portion of Americans (25%) claimed they did not observe shrinkflation in any grocery category. The categories that specific demographics manage to buy more often are the ones in which they may notice shrinkflation versus other products. For instance, Gen Xers and millennials are more likely to observe shrinkflation in meat and produce, whereas boomers tend to notice it in pantry items.

    Categories Where Respondents Observed Shrinkflation


    Source: Morning Consult

    Customers are reacting differently to shrinkflation. The survey shows almost 48% of consumers opted to purchase a different brand and 49% chose a generic product instead during shrinkflation. Retailers and manufacturers need to keep a close watch if the situation persists. Companies' top lines could take a severe hit when a large number of consumers start making similar trade-offs.

    Conclusion

    Shrinkflation is simply downsizing a product while maintaining a constant price range. When inflation is surging, companies tend to downsize as consumers are price-sensitive and may not notice a subtle change in product packaging or carefully read details about the weight and size of the product. Shrinkflation is not a new strategy, but it becomes common during rising inflation or product shortage. Consumers end up paying more for their regular purchases while companies benefit from this ambushed strategy.


  12. NFTs in Gaming - Where Passion Meets Business

    The gaming industry has risen exponentially over the past few decades. From playing Pac-Man on a 4-feet tall

      to read | words

    The gaming industry has risen exponentially over the past few decades. From playing Pac-Man on a 4-feet tall arcade in late-1900s to enjoying 8-bit superhits such as Mario on smaller consoles and immersing in DVD-based action games, for instance, League of Legends, gaming has flourished over time. The Internet revolution accelerated the industry’s growth from a few billion to hundreds of billions of dollars at present. NFT is the new sensation in the gaming business. Supported by crypto capabilities, NFTs are set to boost growth of the gaming industry.  

    The Internet helped the world of gaming evolve into having its own ecosystems. Numerous developers have created unique gaming universes where people can play, purchase items, network, and almost live a virtual life.

    Non-fungible token (NFT) was unheard of until 2020. However, NFT use-cases have expanded since 2021, especially in the gaming business. Every day, new NFT marketplaces and blockchain apps emerge. Such networks are hugely successful among potential customers, with hardly any indication of slowdown in growth. Many online games have introduced their unique NFTs, which are helping them advance in the cryptocurrency rankings. Traders have begun investing in these tokens on realizing potential for profit.

    NFTs are digital certificates that prove ownership of items in the online realm and are registered on blockchains. An early use-case was artists selling their unique copy of digital art in the form of NFTs to users in exchange for cryptocurrency. NFT use-cases are now gradually increasing in other areas.

    NFT Applications


    Source: Aranca Research

    I. NFT in Gamification

    • NFTs have potential to revolutionize the video game industry. “Collecting” has been a popular hobby among people globally. For instance, the iconic board game Monopoly has been played for ages, seconding the human nature of accumulation. Similarly, NFTs can act as collectables, with the added advantage of monetization.
    • Blockchain technology as a distributed ledger system cultivates a degree of trust for digital goods. NFTs will provide easy access for players’ unique digital goods in virtual worlds. Simulated in-game items can be transferred to an individual on an immutable blockchain as “non-replaceable” NFTs, which cannot be deleted, changed, or withdrawn by their creators. The gaming market recognizes the value of each NFT, which players can potentially gain by simply enjoying video games.
    • NFT in gaming works in a simple way. Rewards used in the virtual games are programed as NFTs, which will hold value among players and collectors, and can also be sold. These will not just be digital files with codes, but can also be integrated with other NFTs, which will increase their worth gradually. This synergy of gaming nuances such as rules of play, scoring mechanism, and competition with application of decentralized finance led to the emergence of GameFi, where users can earn by playing.
    • Although various games are currently operational on other blockchain networks, the NFT-based gaming industry was founded on Ethereum. Several games operate across various blockchain networks. In-game items are owned by players in the NFT-based gaming industry; these can be sold on secondary marketplaces. Furthermore, users of NFT-based gaming platforms can rent items to other gamers. As a result, investors seeking high returns may be drawn to the tokens exchanged on these networks. In fact, considerable trading activity was reported for the Axie Infinity NFTs, due to which their value increased in cryptocurrency markets.
    • The popularity of the NFT-based gaming industry is especially influenced by the potential profits from such games. On exchanges, users can convert their NFTs into fiat money. In developing countries, gamers can use NFTs as an additional source of income.

    II. A View into the Future

    Assume Super Mario Bros., an inexorable Nintendo spinoff from the pre-web age, is a GameFi. In this hypothetical game, you get to be Mario for as long as you like, as you own its NFT. You need not be good at playing the game or even play it all day long. As you own the Mario NFT, which is registered in the blockchain ledger, it is impossible to duplicate – you have full ownership of the NFT. Thus, your Mario NFT will always be better and faster than the others in the Mushroom Kingdom. Consequently, the go-kart you drive will always be superior to that of Luigi, Princess Peach, or Toad, as you possess the Mario NFT. Hence, you play to earn the kingdom’s digital money (e.g., Supercoins) with the aim to set the Mushroom Princess free from Bowser and the tribe of turtles.

    As per this game’s economics, people may have to pay heavily for the Mario NFT than for others, for instance, Luigi NFT or Peach NFT. In return, you also earn more as Mario is the sharpest player in the Mushroom Kingdom. When you move out of the game and back to your daily life, you still own the Mario NFT. When you resume playing, the Mario NFT is still there, waiting to earn you more Supercoins.

    You can sell your Mario NFT in the market to other users if you wish. The Mario NFT would now be worth more than what you bought for if the character performs fantastically during the course of the game. This will likely attract more people to try Super Mario and earn. Supercoins may now hold some monetary value as it will become the talk of the town, probably by the hype created by social media.

    GameFi developers are trying to build similar scenarios via blockchain technology. In particular, designers are tokenizing game assets. Gamers can collect and store these tokens in virtual wallets, and trade or sell these in any manner. The more time gamers spend playing a game, the more the chances are of the asset becoming valuable.

    III. How is NFT Gamification Changing the Industry?

    • Additional Source of Income via Play-to-Earn (P2E) Games: Online gaming typically follows the play-to-win model. Through this, players purchase objects and products that aid them in the games. However, gamers do not earn money. The new P2E concept serves as an alternative means of income for gamers who receive compensation for levelling up within a game.
    • The rise of P2E Guilds: P2E guilds emerged due to the popularity of decentralized games, further reducing the entry barriers to NFT-based games. Guild owners can lend players the required in-game assets for "rent". This way, the lender receives a portion of the gamers’ revenue. With more new players, guilds make more money, and new users can also start earning. YGG is one instance of a P2E guild.
    • Interoperability of Game Assets: Interoperability is one of the best features in NFT-based games. It is the ability to use individual game assets in multiple games, if permitted. Interoperability allows NFT-based games to exist on the same or interoperable blockchains, where game assets are exchangeable on marketplaces.

    Source: Aranca Research

    • NFT Staking: This feature enables players to store NFTs or cryptocurrencies in smart contracts, which require a significant initial investment and provide rewards in return. For instance, users that stake MBOX tokens are rewarded with MOMO NFT Mystery Boxes. Each mystery box includes a random NFT of a certain uniqueness that can be sold on the secondary market.

    IV. Popular NFT Games

    Many NFT-based games soon gained popularity among players as a result of the growing popularity of NFTs. Top NFT games in the market, according to online players and trade volume, are listed below.


    V. Why is NFT Ideal for Gaming?

    NFTs bring invariability, proven scarcity, and interoperability to gamers, powered by the blockchain. These benefits ensure that the experience of gameplay is unprejudiced and decentralized.

    Source: Aranca Research

    • NFTs provide owners the authority on the information about the asset in a transparent manner without risking the privacy of the player.
    • NFT game development helps players access their game assets anywhere and anytime outside the game.
    • On the blockchain, it is easy to verify the authenticity of an NFT. This increases the confidence in trade transactions.
    • NFTs allow gamers ownership of their in-game assets instead of game developers. Players can sell these to other gamers or transfer them in other games that accept such NFTs. Furthermore, NFT ownership will not be affected by issues such as delisting of the game in any country. 

    VI. Conclusion

    Although the use of NFTs in the gaming industry has advantages, there are also considerable challenges, such as hacking and fraud, which must be addressed. Above all, NFTs should be made more enticing and understandable to ordinary consumers who may not be tech savvy. NFTs have intrinsic value. Thus, some NFTs may be primarily considered as speculative assets. This is likely to encourage players to buy in-game items with the aim of selling them for a profit rather than utilizing the resources within the gaming environment, as intended.

    The opportunity for financial gains in the gaming sector will encourage more businesses that are not blockchain-focused to experiment with NFTs. Such companies may partner with other blockchain initiatives that have the necessary technological know-how to develop NFTs. Furthermore, the widespread popularity of gaming decentralized apps (DApps) will contribute further to stimulating improvements in the NFT infrastructure and driving the creation of novel solutions that facilitate mainstream usage.


  13. DeFi – Revolutionizing Financial Markets

    DeFi has made considerable progress in a surprisingly short time that would contribute to a more transparent and

      to read | words

    DeFi has made considerable progress in a surprisingly short time that would contribute to a more transparent and accessible future in finance due to rapid technological developments. There are now over 4.5 million DeFi users worldwide, which is anticipated to reach two-digit millions in the immediate future. However, the technology seems to be in a nascent stage and is yet to be fully stress tested at scale over an extended period. While there are concerns over DeFi replacing the traditional financial system, experts suggest they can coexist and thus improve the global finance architecture and benefit the economy worldwide.

    DeFi is one of the emerging financial technologies established on secure distributed ledgers similar to those used by cryptocurrency and blockchain. In simple terms, DeFi is a P2P financial system that aims to eliminate the control banks and institutions have on money, financial products, and services.

    A key phrase associated with DeFi is “smart contracts,” which are computer programs stored on blockchains that automatically get executed when the preset requirements are met. DeFi uses smart contracts to generate protocols that mimic existing financial services in a more open, transparent, and compatible manner.

    DeFi platforms offer common services, including payments, loans, trades, investments, insurance, and asset management. The list is growing swiftly and gives a glimpse of a modern era of crypto-based innovation such as decentralized exchanges, synthetic assets, and flash loans. 


    DeFi Use Cases

    1. Data Analytics: Data analytics has undoubtedly become one of the most significant applications of DeFi in recent years. DeFi projects are anticipated to deliver considerable value in terms of analytics and risk management.
    2. Decentralized Autonomous Organizations (DAOs): DAOs are centralized financial institutions' counterparts, making them one of the pillars of DeFi use cases. Unlike centralized financial bodies, DAOs are decentralized and do not follow boundaries established by authorities.
    3. Asset Management: One of the most significant features of DeFi is that it gives users more control over their assets. Many of the most popular DeFi projects provide tools for users to manage their assets, such as purchasing, selling, and transferring digital assets.
    4. Infrastructure Tooling: Composability, a fundamental design principle of DeFi protocols, allows different components of a system to connect and communicate with one another. The concept of an integrated ecosystem is one of the most salient characteristics of DeFi.
    5. P2P Lending and Borrowing: The DeFi ecosystem is appropriate for P2P borrowing and lending. As traditional banking systems are becoming obsolete, the emergence of a lending and borrowing use case proves crucial. Several DeFi projects focusing on this use case have already entered the marketplace. 

    Benefits 

    DeFi offers various benefits for customers and investors such as eliminating intermediaries alongside centralized control and improving the accessibility of financial markets to institutional investors. DeFi would also work on creating new investment opportunities that can further assist in taking the concept to higher levels.

    The decentralization approach can be effective for democratization of finance and banking. DeFi is permissionless and inclusive. Furthermore, it allows users to trade and move assets anywhere without having to pay any bank charges.

    Anyone with a crypto wallet and internet connection can access DeFi services, regardless of where they are. The permissionless nature of its applications could also use blockchain's interoperability feature. In addition, the blockchain architecture ensures DeFi data is secure, tamper-proof, and auditable.

    DeFi transactions happen in real time and are transparent. The underlying blockchain is updated once a transaction is completed, and interest rates are updated several times within a minute. Furthermore, every transaction on the Ethereum blockchain is broadcast to and confirmed by other users on the system.

    Disadvantages

    Most of DeFi problems and risks are primarily associated with related technologies. The challenges with blockchain are generally responsible for hampering the penetration of DeFi.

    DeFi technology is still considered immature and yet to be fully stress tested at scale over an extended period. Funds may be lost or put at risk. Recently, DeFi platform Compound faced a major glitch where customers were accidentally sent millions of crypto dollars.

    Users have limited or no protection in the DeFi space, as the technology is not covered by any state-run reimbursement scheme, and there are no laws in place to administer and regulate capital reserves for DeFi service providers.

    There are concerns over the uncertainty and liquidity of DeFi projects and blockchain protocols. In the event of instability in the blockchain hosting of a DeFi project, the project could automatically inherit instability from the host blockchain.

    DeFi projects encounter daunting difficulties in the scalability of the host blockchain from various perspectives. Furthermore, DeFi transactions could become extremely expensive during the congestion period and may require a considerably long time for authorization.

    How does DeFi differ from traditional financial systems?

    In centralized finance, the money is held by banks and corporations whose primary goal is to make money. The financial system has third parties that enable money movement, each charging fees for using their services.

    Decentralized finance eliminates intermediaries by permitting people, merchants, and businesses to conduct financial transactions through a P2P financial network that uses security protocols, connectivity, software, and hardware innovation.

    DeFi uses this technology to eliminate centralized finance models by allowing anyone to use financial services anywhere, regardless of who or where they are. Moreover, DeFi applications give users control over their money through personal wallets and trading services.

    Impact on traditional banking system 

    The notion of a new technology seeking to displace established institutions and conventional ways of transactions was not well received by financial authorities. However, the financial landscape is being disrupted, and the industry should consider DeFi as a long-term business model.

    Banks were initially skeptical about blockchain and the adoption rate was modest. However, with countries such as Canada, China, and the UK exploring a central bank digital currency, it is bound to take off. Financial institutions must understand that DeFi is a natural ecosystem and is here to stay. We already see proof of concepts and collaboration in this space, as ING Bank (Netherlands) analyzed the risks and opportunities associated with exploring the DeFi space.

    Experts suggest DeFi and traditional financial systems can coexist, benefiting the broader economy. Banks must proactively adopt DeFi by generating novel DeFi propositions and engage with policymakers to explore how to regulate those schemes while maintaining DeFi's decentralized characteristics.

    Banks can start offering DeFi services for unserved markets. Simultaneously, they should modify their internal compliance routines to connect their banking services and the larger fiat economy to all the opportunities that DeFi can provide. It is crucial for the banks to look at DeFi from an innovation perspective.

    How is it shaping the future?

    DeFi is still in its early stages of evolution with the system being unregulated, meaning it is still riddled with infrastructural mishaps, hacks, and scams. Many questions must be answered before DeFi becomes safe to use.

    It is important to note that banks may not let go of their primary means of making money. If DeFi succeeds, it is highly likely that banks would find ways to get into the system—if not to control how money is accessed, then at least to make money from the system.

    Market demand for DeFi is soaring, as locked-up assets surged from less than USD1 billion in 2019 to over USD200 billion within two years, attracting over one million investors in the process. The DeFi market is projected to reach USD800 billion over 2022–23 as more and more institutional investors are venturing into the industry.

    Conclusion

    Although DeFi has become popular in a short period, it has a long way to go in order to be a part of our daily lives. Some might opine that the benefits of DeFi outweigh its drawbacks, but major issues such as security and scalability must be addressed before its full-scale implementation. DeFi's blockchain-based ideas are expected to become embedded in the basic architecture of global finance. The technology is here to stay in the long term, with many experts suggesting it can coexist with traditional financial systems, thus benefiting the economy and its financial landscape.


  14. Capturing the Opportunity of Carbon Capture & Storage Technology in Petrochemicals

    The growing need for environmental sustainability has impelled petrochemical companies worldwide to look for ways to reduce carbon

      to read | words

    The growing need for environmental sustainability has impelled petrochemical companies worldwide to look for ways to reduce carbon emissions and reach net zero emissions by 2050. Industry leaders globally have been collaborating on exploring carbon capture and storage (CCS) technology as a means to significantly reduce carbon emissions from their petrochemical plants. As this technology is in a nascent stage, companies that make an early entry in developing and investing in CCS and related infrastructure would provide good investment opportunities, considering they would largely benefit as CCS technology gets adopted across the petrochemical industry.

    Petrochemical Industry – A Major CO2 Emitter

    Petrochemicals are versatile chemical compounds produced from petroleum or natural gas to manufacture plastics, polymers, resins, paints, and other essential daily-use products. They are also used in electric vehicles, renewable energy, and medical sciences, among other applications. They are also instrumental in the promotion of novel technologies to increase efficiency and improve product performance while keeping the cost low.

    However, the petrochemical industry has a hazardous impact on the environment during the manufacturing process and disposal of end-use products, and majorly contributes to air pollution. The growing awareness and concerns about climate change and sustainability have pushed governments and regulatory bodies all over the world to monitor business operations closely in this regard. The focus now is to achieve targets of net zero emission by 2050 and limit the rise in global temperatures to 1.5°C as decided in the 2015 Paris Agreement. The chemical and petrochemical sector is the third largest contributor to CO2 emissions, ranking behind the iron & steel and cement industries. The petrochemical sector relies extensively on oil & gas as feedstock, and its production is a major source of CO2 emissions. As per the International Energy Agency (IEA), primary chemical production resulted in 920 MT of direct CO2 emissions in 2020, which have been growing at an average rate of 2.1% since 2015. The direct emissions are expected to reach 950 MT in 2025 and reduce to 840 MT by 2030, as companies focus on staying within the 2050 net zero target, despite a 25% increase in demand for primary chemicals.

    Source: IEA

    CCS Technology – A Catalyst to Minimize Carbon Emissions

    Petrochemical companies across the globe are striving to achieve CO2 reduction goals by 2030 by decreasing coal usage and improving energy efficiency. The carbon capture and storage (CCS) technology is evolving as a propitious solution to this problem, where CO2 emitted from manufacturing plants is captured and stored instead of being released into the atmosphere. The captured carbon can then be used in a productive manner. As per the Independent Commodity Intelligence Services (ICIS), no more conventional crackers would be built in North America; all new ethane-based crackers would include mechanics such as CCS, electric furnaces powered by renewable energy, and ethane dehydrogenation. As per Bloomberg NEF estimates, manufacturing petrochemicals with almost zero carbon emissions requires the petrochemicals industry to incur additional capex of ~USD759 billion by 2050 and requires the usage of technologies such as electrification and CCS to reduce emissions.

    ExxonMobil proposed a Houston hub for CCS in April 2021 with an aim to capture up to 50mn MT of CO2 by 2030 and 100 MT by 2040 and urged participation from the industry and government to raise USD 100 billion to develop the required infrastructure. Following this move, 14 global companies – including Calpine, Chevron, Dow, ExxonMobil, INEOS, Linde, LyondellBasell, Marathon Petroleum, NRG Energy, Phillips 66, Valero, Shell, Air Liquide, and BASF – collaborated on the Houston CCS hub project.

    Decarbonization project plans are also being implemented in China, where ExxonMobil, Shell, CNOOC, and Guangdong Provincial Development and Reform Commission have signed an MoU to assess the possibilities of a worldwide CCS project to reduce greenhouse gas emissions at Dayawan Petrochemical Industrial Park. ExxonMobil is in the process of investing USD3 billion through 2025 in its new business, ExxonMobil Low Carbon Solutions, that would initially focus on CCS technology around the world and move on to newer technologies as it reaches commercialization.

    In October 2021, Dow announced plans to build the world’s first net zero carbon emitting ethylene cracker at its Alberta site by retrofitting existing assets to adhere to net zero emissions. This would decarbonize 20% of the company’s global ethylene capacity. Dow intends to decarbonize its assets globally site by site by incurring annual capex of ~USD1 billion as part of its commitment to carbon neutrality.

    Global petrochemical leaders have been partnering and collaborating with engineering and tech firms to develop plant infrastructure that help them achieve their carbon neutrality targets. This includes BASF’s joint project with Air Liquide (November 21) to develop the world’s largest cross-border CCS value chain, INEOUS’s partnership with the Acorn CCS project (July 21) to develop Scotland’s first CCS system by 2027, and Braskem’s partnership with the University of Illinois (December 20) to evaluate a potential pathway for capturing and storing emitted CO2. SABIC built the world’s largest carbon capture and utilization in 2015. Moreover, in its current roadmap to carbon neutrality, SABIC affirms its consideration of carbon capture utilization and storage technology.

    Producers, including Dow Chemical and ExxonMobil, have been pitching to set a price on carbon emissions. This could incentivize petrochemical manufacturers and accelerate investments in CCS and related decarbonization infrastructure. However, companies' technology choices depending on capital investment required, alongside enforced regulation, would be instrumental in determining the success of such novel plants.

    CCS – An Investment Opportunity

    Although CCS technology has been in existence for more than a decade now, it is not yet widely implemented due to the high initial cost of building these plants and the challenges associated with the transportation of the captured carbon. However, demand for carbon capture is currently growing, fueled by the need for sustainability. Companies, ranging from oil & gas giants to startups, are experimenting with innovative technologies to capture, store, and use carbon from emissions.

    We believe the CCS market is promising and has a significant upside potential as the adoption of the technology is still in a very nascent stage. We have listed the categories of companies that support the much-need CCS transformation as an investment opportunity below.

    1. Companies that have their own proprietary CCS technology, e.g., Carbfix, Quest, CarbonFree, Carbon Engineering, Climeworks, CO2 Solutions, Aker Carbon Capture, and Global Thermostat
    2. Engineering companies that can upgrade existing petrochemical plants to CCS-enabled ones, e.g., Fluor Corporation, Jacob’s Engineering, and Technip Energies
    3. Petrochemical companies committed to substantial investments in CCS technology to meet emission targets and business goals, e.g., BASF, Dow, LyondellBasell, INEOS, Braskem, and SABIC

    Additionally, investors can capitalize on CCS technology through carbon capture ETFs.

    We believe the adoption of CCS technology and consequentially investment in companies involved in the technology would gradually scale up over the next 3–5 years. This would take place gradually as companies implement the required changes in their plant infrastructure to align with their 2030 interim goals of carbon emission reduction.


  15. Buy Now Pay Later: The Latest FinTech Disruption in Payments

    BNPL is a FinTech option that allows buyers to buy now and pay over a period of time.

      to read | words

    BNPL is a FinTech option that allows buyers to buy now and pay over a period of time. Unlike the regular loans, BNPL does not involve paperwork ­– customers can access it almost instantly using their smartphones. Besides helping customers raise credit easily and boosting the sales of consumer goods and other white goods, BNPL helps merchants to explore new borrowers. Accessing credit via BNPL is easy and hassle-free compared to a traditional loan; however, consumers must exercise utmost caution before using the BNPL facility as it is also a type of loan which must be repaid. The sector has faced intense scrutiny from regulators recently over awareness concerns. Nonetheless, BNPL’s future appears very bright.

    Today, online shopping is a regular activity undertaken by a large number of consumers. Earlier, retailers would publish and distribute shopping catalogs enlisting the items on offer for consumers to browse through. Consumers would order the required items via mail and make payments via bank transfers or cheques. Another option (in some cases) included paying in installments (usually with an added fee component or some interest).

    E-commerce transformed the entire process and brought about significant changes in customers’ behavior and expectations regarding the shopping experience. The yesteryear catalogues were replaced by interactive websites providing a 360-degree view of the products as well as their features. Subsequently, credit cards, net banking, and digital payment services such as PayPal emerged.

    Growth in e-commerce has been closely linked to innovation and disruption in FinTech, especially digital payments. Consumers now have the luxury of buying goods and paying for them online. The latest innovation in the payments space is the digitization of paying in installments, also known as “buy now pay later” (BNPL).

    What is BNPL?

    BNPL is a financing option that allows customers to purchase items online in flexible installments, instead of paying the entire amount up front. Thus, it provides customers with a seamless purchasing experience as well as the flexibility to raise credit, often interest-free.

    Moreover, BNPL helps merchants increase the value of online orders as well as sales conversions while keeping the user acquisition costs in check.

    BNPL as a financial product has attracted millions in investment around the world, leading to the success of startups such as Afterpay, Affirm, and Klarna. PayPal has launched its own BNPL offering in the US.

    Growing Popularity

    One of the direct effects of the pandemic has been the surge in online shopping coupled with the acceleration of e-commerce, thereby boosting the demand for BNPL companies. The momentum of boom in consumer spending is set to continue with consumers receiving goods at their doorstep on the click of the mouse.

    BNPL companies have positioned themselves as a viable alternative to credit card issuers, banks, and consumer lending institutions. They have been able to quickly acquire customers in recent years by offering services with a differentiated value proposition, in a manner where the incumbents fell short.

    The funding activity and number of deals closed in the BNPL domain reflect the rise in interest in this sector. BNPL companies witnessed consistent momentum in deal activity throughout 2020, despite the onset of the pandemic.

    Source: CB Insights, Aranca Analysis

    The sector has been gaining momentum within the corporate circle as well. During earnings calls in 2020, BNPL and related terms were mentioned a record number of times, implying the skyrocketing focus of executives on the sector.

    Source: CB Insights, Aranca Analysis


    As per CB Insights, BNPL accounts for a small portion of the overall spending on payment cards (credit, debit, and prepaid), an industry recording nearly $8 trillion in annual spend volume in the US.

    However, there is growing consensus and evidence that BNPL is at an inflection point. In terms of volume, the global BNPL industry is expected to grow 10–15x by 2025, recording $1 trillion in annual gross merchandise volume (GMV), as per estimates.

    BNPL can be classified into two, as given below:

    Source: Aranca Analysis

    Consumers and merchants are increasingly adopting BNPL solutions to reduce financial pressure and meet online shopping demand, respectively.

    The Point of Sale (POS) system has been at the core of many business operations and is widely available (from local grocery stores to malls, high-end shops, food establishments, and beyond).

    POS lending is a convenient tool which allows the customers to make purchases in incremental payments. 

    Advantages of BNPL:

    Source: Aranca Analysis

    How Do BNPL Companies Make Money?

    The BNPL revenue model includes collecting money from both merchants and consumers.

    If the customer uses BNPL service, the merchant needs to pay the service provider a fee ranging between 2% and 8% of the purchase price. The service offerings of the BNPL are positioned as a marketing or promotional spend, provided the merchant can increase conversion or traffic.

    BNPL allows customers to make payments through flexible installments, helping them to raise interest-free credit. However, if customers are unable to repay the amount by the due date, a late fee is charged. This fee adds to the revenue of the BNPL company. If the customer repays on time, no interest is charged.

    Is the Future Really Bright?

    The outlook for BNPL appears bright as it is expected to encourage more customers to purchase a product of their choice on the go. Many lenders providing this facility allow repayment at no-cost EMIs; this feature is likely to appeal to the youth the most.

    The BNPL market is expected to grow to ~USD 700 billion by 2023, with penetration reaching 12%, led by North America and the APAC region.

    Source: Deutsche Bank, JP Morgan, BCG Analysis, Aranca Analysis
    Note: 1. Excluding LATAM; 2. BNPL market penetration % represented as percentage of total e-commerce

    Notably, BNPL is also a kind of loan that customers are required to repay. BNPL companies need to be vigilant while offering the service as all customers may not be able to repay the amount within the stipulated time. Ideally, the companies should perform due diligence to verify the borrower's creditworthiness. However, the BNPL business model allows customers to purchase a product of their choice instantly. At the same time, the customers need to understand that any failure to repay the amount on time will lead to penalty charges, most likely in the form of interest and/or significantly high late fees, and a drop in their respective credit scores. 

    BNPL services claim to provide consumers with control over their finances and help them avoid falling into a vicious circle of unsustainable debt; nonetheless, consumers could face the risk of getting into debt. As BNPL makes purchasing easy, it may encourage consumers to spend beyond their means, leading to impulse buying; this may promote a hyper-consumerist culture.

    BNPL’s popularity surged exponentially during the pandemic as it created an opportunity for users to pay in flexible installments. However, consumers’ purchasing power is likely to reduce, given the current macroeconomic environment, rising inflation, and slowing economic growth; moreover, higher interest rates may tighten BNPL providers’ margins.

    Recently, the sector has faced intense scrutiny from regulators over concerns that users are not being well educated about the fact they are actually getting into debt to finance their purchases; this has been creating more caution than interest among people.


  16. US Pet Food Industry on the Rise

    Pet ownership increased during lockdown when people were confined to their homes. Pet humanization has led to owners

      to read | words

    Pet ownership increased during lockdown when people were confined to their homes. Pet humanization has led to owners treating pets as part of their family. Owners are increasingly concerned about their pets’ health and nutrition and are looking for high quality and nutrient-rich food products. Pet food manufactures have been quick to tap into this rising demand to develop organic, natural, and high nutrition products. According to the American Pet Products Association, pet food sales increased 19.3% year-on-year to USD123.6 billion in 2021. Large pet food and treat manufacturers are expanding their production lines to meet growing demand. The pet food industry has shown resilience during the recent economic downturn and is expected to grow further.

    With the rollout of vaccination in 2021, the economy was anticipated to return to normal levels. However, the Omicron variant led to re-implementation of social distancing measures and hybrid work environment. Despite the adversities caused by rise in inflation, supply chain disruption, staff shortage, and market volatility, some of the products and services industries, such as the pet food industry, benefited from the lockdown and mobility restriction.

    Globally, pet ownership continued to grow in the second year of COVID, albeit at a slower pace. There was a growing desire to adopt companion pets during lockdown as it helped keep issues such as depression, anxiety, and loneliness at bay. However, owing to supply chain disruption and resultant challenges in production and logistics, supply could not meet rising demand for pet food.

    As per the World Economic Forum, pet owners believed pets made them feel less lonely during the pandemic and gave them a sense of purpose. There was a 250% surge in global searches by prospective pet owners between April and May 2020 compared to the year-ago period.

    Pet humanization drives the pet food industry. Furthermore, rising interest in pet health and nutrition has increased spending on sustainable, organic, and premium products. High income households prefer branded and high-nutrition food products.

    North America is the largest pet food market (USD37 billion in 2020), followed by Western Europe and Asia. In the US, pet adoption is influenced by lifestyle, high standard of living, and prevalence of nuclear families.

    As per the American Pet Products Association (APPA), the pet food industry recorded USD123.6 billion in revenue in 2021, its highest level so far. The 2021–2022 APPA National Pet Owners Survey shows 90.5 million households in America own a pet, equivalent to almost 70% of homes. Of this percentage, dog ownership (69.0 million) was the highest, followed by cat (45.3 million), freshwater fish (11.8 million), bird (9.9 million), small animal (6.2 million), reptile (5.7 million), and saltwater fish (2.9 million) adoption.

    Source: AlphaWise Research, Morgan Stanley

    The pet food business is a recurring revenue stream, and loyal customers do not change their pets’ diet frequently. The market for pet food is recession-resistant, as evidenced by the surge in the sale of pet products amid the pandemic.

    Pet owners largely spend on pet food and treats (USD50.0 billion); supplies, live animals, and OTC medicine (USD29.8 billion); veterinary care and product sales (USD34.3 billion); and other services (USD9.5 billion). Other services include lodging, grooming, insurance, training, pet sitting and walking, and various services apart from veterinary care.

    Major players in the pet food industry include Mars Petcare, Nestle Purina Pet Care, J.M. Smucker, Hill's Pet Nutrition, General Mills, and Diamond Pet Foods.

    Revenue and brand details:


    Pet ownership surges amid recession

    The US pet industry is highly dynamic in nature, with pet ownership posting record highs during the pandemic. According to Morgan Stanley Research, the US pet industry has reached a turning point and is estimated to advance at a CAGR of 8% as opposed to 3% growth recorded in the last decade. Changes in consumer behavior, demographics, and household formation could lead to the industry growing threefold from USD118 billion in 2019 to USD275 billion by 2030.

    Typically, recession alters consumer buying behavior as income hits a rough patch. Eating habits change as consumers prefer eating at home rather than dining out. As a result, the packaged food market and grocery stores tend to do well during recession.

    Source: American Pet Products Association

    Sale of pet food treats surged 19.0% from 2020 to 2021, recording the highest level of growth. This growth was due to a change in consumption patterns and spike in pet food demand. The pet food sector was severely impacted by supply chain disruption and yet outperformed within the industry, clearly indicating a rise in consumption amid recession. New pet ownership and ecommerce have driven and would continue to drive the industry; the two factors have also helped the industry become resilient despite the recession.

    M&A in pet food industry

    During the pandemic, the nature of M&A activities in the pet food industry changed drastically as an increasing number of pet food brands started venturing into the ecommerce space. Remote working and social distancing became the new normal during the crisis. A shift in buying channels was seen among pet owners as internet sales rose dramatically.

    • In 2020, the pet food industry witnessed around 27 M&A between suppliers and manufacturers.
    • In 2021, there were 44 M&A transactions in the pet food industry

    According to Debbie Phillips-Donaldson, editor-in-chief of Petfood Industry, the pet food sector had attracted new investors, including human food companies and various private equity firms, before COVID. However, with the outbreak of the pandemic, M&A activities witnessed a slump in 2020. Nonetheless, the sluggishness was short-lived and the year 2021 saw an increase in pet ownership as well as spend on pet food, products, and services.

    Factors such as:

    • The ecommerce boom in the pet food market
    • Rise in pet ownership
    • Change in buying behavior
    • Emergence of new pet stores, vets, retail, and pop-ups are expected to provide an impetus to the industry

    Acquisitions in this space are considered a lucrative opportunity for companies in the pet industry.

    • General Mills' acquisition of pet food giant Blue Buffalo in 2018 turned out to be a profitable venture.
    • In the quarter ended November 2021, pet food contributed 11.8% to the company’s total revenue.
    • Pet food sales surged to USD593.4 million during the quarter from USD460.0 million in the same period last year
    • With the acquisition, General Mills was able to hold sway over retailers, and it also helped in expanding Blue Buffalo into new segments
    • Given the increased pet adoption being witnessed in the US, the company would be able to capture market share by targeting new customers across the sector

    Growing adoption of pets has generated business opportunities for the industry, as owners are becoming more and more concerned about their pets’ diet and food consumption. Pet food brands are addressing consumer demand for sustainable pet food healthy and premium quality food as well as minimally processed food with fewer artificial preservatives.

    Pet food manufacturers are automating the production process to improve safety and efficiency. Use of innovative manufacturing technology, such as automating formulation, batching, drying, coating, and liquid delivery, is helping companies achieve efficiency in cost and ensure product quality. In addition to pet food stocks, investors should consider ancillary industries such as the market for pet medication, veterinary products, pet insurance, pet grooming, and wellness products. Growth trends due to increasing demand among millennials make the pet food market attractive. Although the market witnessed a boost during the pandemic, owing to the pet humanization trend, the industry would continue to grow and present numerous investment opportunities. The US Pet Food Industry is a lucrative sector to watch out for as the demand for pet ownership is on the rise and the pet owners are placing high importance on their pet's health and nutrition.  


  17. The Other Side of ESG Investing

    Environmental, social, and governance (ESG) factors play a critical role in investment analysis, actions, and recommendations. Globally, investors

      to read | words

    Environmental, social, and governance (ESG) factors play a critical role in investment analysis, actions, and recommendations. Globally, investors are looking at different methods such as positive or negative screening, green finance, thematic investing, shareholder engagement, and activist ownership to include ESG factors. Sustainable investing is the new buzzword for successful investing. However, various private ESG data providers use inconsistent scoring approaches or inappropriate constraints and assumptions. Lack of standardization and transparency makes it tough for investors and analysts to determine the effectiveness of ESG scoring. Additionally, companies having a low environmental score, owing to uncertain emissions reduction targets, but a high social and governance score may not be considered ESG compliant by a few market participants. This lack of uniformity has given rise to issues such as greenhushing and greenwashing.

    Sustainable investing has gained popularity as an increasing number of institutional investors are acknowledging the ESG factors as value creators. ESG has become the new buzzword in responsible investing as a growing number of market participants are considering impact investing. Investment giants such as Blackrock, Vanguard, Japanese Government Pension Investment Fund, and Norwegian Government Pension Fund Global have been practicing sustainable investing for a few years now. In March 2022, the Japanese Government Pension Investment Fund moved a step forward by adopting an ESG Index for Japanese equities. However, ESG disclosures are not standardized and unform across companies and sectors; this could become a major threat to effective ESG disclosure for businesses. Majorly, ESG disclosures have guidelines that vary across firms, making it challenging for various stakeholders to evaluate opportunities effectively and fairly. This lack of uniformity has given rise to issues such as greenwashing and greenhushing. Theoretically, ESG factors provides investors with insights into a company’s exposure to various ESG risks. Companies with a low carbon footprint, active employee engagement and welfare goals, competent management, and sound corporate governance tend to outperform the market in the long run.


    As per Global Sustainable Investment Review 2020, global sustainable investment reached approximately USD35.3 trillion in 2020 in five core markets: Europe, the US, Canada, Australasia (Australia and New Zealand), and Japan. It surged 15% during 2018–20 as sustainably invested assets continued to grow globally except in Europe, due to the EU legislation in this region, making past comparison difficult.

    Greenwashing

    As ESG factors became popular and the need for companies to become ESG-friendly rose, companies started resorting to greenwashing. Greenwashing is a practice wherein companies convey false claims and impressions about the sustainability component of products. A firm may spend resources falsely marketing its products as green, to portray itself as a environmentally and socially responsible player. Furthermore, its green targets may be vaguely set or too ambitious to achieve. Oil and gas companies are well known for greenwashing. Researchers at Columbia University found that investors are frustrated due to the environmental disclosures made by American oil and gas firms such as questionable claims. Inadequate government regulations add to this. BP, for instance, rebranded from British Petroleum, created the ‘Beyond Petroleum’ slogan and changed its logo to portray itself as an environment-friendly company. However, even today, BP derives most of its revenues from oil and gas. BP is also embroiled in the controversial oil spill in the Gulf of Mexico. As awareness spreads, many companies are being accused of greenwashing.

    Greenhushing

    When companies adopt sustainable practices but do not report them, it is called greenhushing. To avoid being accused of greenwashing and the scrutiny that follows, businesses are intentionally not publicizing the sustainable initiatives they implement. A survey was conducted on 2,000 hotels across 44 nations and the results have been included in Green Lodging Trends Report 2016. As per the report, most of the hotels adopted sustainable practices such as using LED lights, reusing water, reducing water consumption, recycling, and using certified green products. However, only half of them advertised these initiatives. Moreover, companies need to incur high costs and put in considerable efforts to obtain a certificate that can vouch for their green initiatives; this forces them to practice greenhushing.

    When companies practice greenhushing, they fail to inspire their competitors to make a greener change, and to act as a role model. They may also miss out on investments from ESG-conscious investors and loyalty from ESG-conscious customers.

    ESG Purists Versus Pragmatics

    It is worthwhile to consider the case of Danone to explore the issues arising from discord between sustainability pioneers and profit-seeking stakeholders. Danone SA, a global food and beverage company, operates through four business segments: Dairy, Plant-Based Products, Specialized Nutrition, and Waters. In 2021, Danone’s Board ousted CEO Emmanuel Faber under pressure from activist shareholders such as Bluebell Capital Partners and Artisan Partners. Faber was one of the leading executives who constantly promoted stakeholder capitalism and ESG-based sustainability across core business units. His departure uncovered disagreement between advocates of sustainable capitalism and resilient corporate activists.


    The rebased comparison is a depiction of Danone’s uninspiring performance against the MSCI Europe Consumer Staples Index, which consists of peers, over the last five years. The black line indicates the period in which Faber was appointed as the CEO of Danone. The gap between the index and Danone’s performance widened after Faber’s appointment.

    Faber’s sustainable way of doing business came under scrutiny when the company reported poor sales and margins compared to competitors. Under Faber’s tenure, Danone’s fresh dairy segment had global leadership, and its special nutrition and bottled water segments dominated the global market share. Faber introduced the concept of carbon-adjusted earnings per share. To make Danone a purpose-driven company, he launched "One Planet for Biodiversity" initiative to promote international cross-sectorial and action-oriented business partnership on biodiversity. However, his ESG-focused strategies failed to impress the likes of activist shareholders.

    According to former Unilever CEO Paul Polman, aiming for sustainability is not good enough as companies may not be able to generate profits from solving world problems. In his book titled Net Positive: How Courageous Companies Thrive by Giving More Than They Take, Paul argues that sustainability is not good enough as companies have started to understand the need to be restorative, reparative, and regenerative. He states that net positive leaders take responsibility for their cumulative impact on the world; such leaders promote transparency and target cooperative leadership. The world’s problems are too big for a single company to solve.

    EU Taxonomy for Sustainable Activities

    There are multiple private ESG data providers who use non-standardized scoring methodologies, or factors and assumptions which may not be wholly transparent. Furthermore, ESG data such as the level of carbon emissions may not be available for all firms. This reduces the relevance of ESG scores (for investors). To help solve these issues, the EU taxonomy for classifying and establishing environmentally sustainable activities has been established. The system helps firms and stakeholders differentiate between green and non-green assets.

    Asset managers are required to disclose the percentage of products which are green as per the taxonomy. Moreover, European companies are required to report the share of revenues and capital expenditures in compliance with the taxonomy. This classification also applies to the green bond issues in the EU.


    The EU taxonomy has the potential to become a global standard. As per a Berenberg ESG survey, after the taxonomy labelled nuclear energy as green, the number of funds excluding nuclear power in their ESG criteria dropped from 43% in 2021 to 37% in 2022. Firms outside the EU may adopt the taxonomy as their EU clients demand correct data from them for their own disclosures.

    Road Ahead

    ESG factors play a critical role in companies’ decisions on mergers, acquisitions, divestitures, etc. Regulators and policy makers expect the corporate sector to address issues such as environmental pollution and lack of diversity at the workplace. However, ESG regulation as well as analysis needs a focused consideration as the one-size-fits-all approach for evaluating companies may not help. For instance, a conglomerate operating a tobacco business despite being well governed may receive a negative score if its tobacco business is a major revenue generator. Similarly, a retail outlet selling FMCG goods in a highly sustainable environment may receive a negative score if it sells tobacco and related products. Just a handful of organizations cannot bring about a social change. A profitable entity can afford to focus on transformation as it can offset the associated costs through economies of scale. It would be interesting to see how a small-scale business unit implements sustainable practices and thrive economically.


  18. Thematic Investing on the Rise

    Disruptive technology is constantly reshaping the world. Despite the pandemic-induced lockdown, seamless internet connectivity enabled access to a

      to read | words

    Disruptive technology is constantly reshaping the world. Despite the pandemic-induced lockdown, seamless internet connectivity enabled access to a virtual world where we could work, shop, and even meet people. Due to mobility restriction, labor shortage, and supply chain disruption, manufacturers have turned to robotics. Breakthrough treatments and medical advances in healthcare have helped combat the pandemic crisis. Climate change has shed light on vehicle electrification and the shift to renewable energy. Consequently, technological advancements such as AI, machine learning, blockchain, robotics, and data analytics are gaining popularity. The benefits of these disruptions, or rather “trends” and “themes,” are manifold. These trends are increasingly changing the way investors manage their portfolios.

    What is Thematic Investing?

    Thematic investing focuses on long-term structural trends and ideas to capitalize on them, rather than focusing on specific sectors and/or companies. It enables investors to get returns through potential opportunities created by economic, social, and technological changes. A theme-based investment approach allows investors to “personalize” their portfolios to include investments that are aligned with their interests or expectations and are geared toward select trends.

    Thematic investing differs from other approaches of investing such as market capitalization, geography, style, value, momentum, and/or sector. In the past, investors had approached thematic investing through stocks, but thematic investing can include other asset classes as well such as bonds or real assets.

    The goal of thematic investing is to identify investment opportunities that would give high returns due to structural changes in the underlying well-defined theme.

    Source: Aranca Analysis

    Global Landscape

    Thematic investing has been gaining traction and popularity, leading to the emergence of many new thematic strategies in recent years.

    Morningstar reported there were a total of 1,349 thematic funds by the end of March 2021. Over the past three years, AUM of these funds more than tripled from USD174 billion to USD596 billion worldwide. This amounts to 2.1% of total assets invested in equity funds globally, up from 0.6% over the last decade.

    As these funds attracted more money, the scope of thematic funds broadened. A record 237 new thematic funds were launched worldwide 2020, up from 167 in 2019.

    Source: Morningstar, Aranca Analysis

    The growth of thematic funds has been uneven across the world. Europe is the largest market for thematic funds and its share in the global thematic fund market has grown to 51% from 10% in 2001. The market itself has grown twenty-eight times in size. While all the regions have witnessed net inflows, the US and Europe have been the prime beneficiaries of this growth saga.

    One factor usually cited for driving the rise of thematic investing is that fund managers, at the request of a specific investor research, develop, and create a pool of investments that exhibit a particular theme.

    Five Types of Thematic Investing

    Thematic investing has various categories and approaches, which differ in terms of investor expectations and the ideology that determine the underlying investments.

    Thematic funds (including mutual funds and ETFs) that are universally available to investors via various approaches are:

    Source: Fidelity, Aranca Analysis


    1. Disruption: Investors who follow trends and the expected shifts or disruptions are likely to benefit from opportunities that arise when the market tends to underestimate the pace of change. Technology can cause rapid shifts in business models, and if market participants are not ready for it, it can cause a massive shift. A fund with an investing strategy centered on disruption is likely to focus on long-term structural trends, where industries and/or companies could be in the preliminary stages of development and working at driving a long-term change. For instance:

    2. Source: Aranca Analysis

    3. Megatrends: Megatrends are characterized by identifying trends that could lead to significant changes and transformations over the course of decades. Examples of megatrends include demographic shifts, long-term structural trends expected to transform global economies, technological advancements and innovations, regulatory and/or political changes, social and/or behavioral changes, and environmental developments. Megatrend funds focus on understanding the increasingly important drivers of long-term growth in earnings and returns.

    4. Source: Aranca Analysis

    5. ESG: Environmental, social, and governance (ESG) are the three crucial factors that an investor or a fund manager might consider before deciding to invest in a company. ESG focuses on how the company’s environmental, social, and governance practices impact society both positively and negatively. Many investors may be interested in gaining exposure to trends of sustainable business and sound corporate governance practices as well as social and human capital factors. Thematic investing in ESG is likely to provide the means to invest in an underlying theme that reflects a careful evaluation of these considerations.


      There are various ways to be an investor in the ESG domain, each with a specific approach to investment selection.

    6. Source: Fidelity, Aranca Analysis

    7. Differentiated Insights: Some thematic investing strategies are built around differentiated insights that usually do not fall under the categories mentioned above. These are also different from other approaches such as investing by market capitalization, geography, style, value, momentum, and/or sector. A differentiated insight fund helps an investor get exposure to targeted ideas and investment selections. They can choose to invest in companies that share the same characteristics, which may prove advantageous over the long term. For instance: 
      • Investing in companies that are still led by their founders
      • Investing in stocks of companies that use higher-than-average levels of leverage
    8. Outcome Oriented: In outcome-oriented thematic investing, the investment strategies that have been designed to pursue a particular set of outcomes in a portfolio. For instance, an investor who wants to largely remain invested in US stocks but is worried about inflation over time and its impact on their portfolio can choose to invest in an outcome-oriented thematic fund. This would also provide them exposure to companies and market segments that have historically performed well amid rising inflation.


      Similarly, funds that are designed to provide lower volatility of returns or minimize the impact of market downside choose to invest in stocks that have been less volatile historically and/or have performed better during times of market downturns.


      Investors following an outcome-oriented strategy would benefit from this type of thematic investing by seeking an outcome over a long term than by receiving short-term returns from that strategy.

    Breaking Down a Theme – Theme and Sub-theme

    Source: MSCI, Aranca Analysis

    Source:  Aranca Analysis


    As global economies adapt to highly impactful structural changes, investors have been willing to change course and accordingly adapting their portfolios and investments to capture the potential upside associated with these opportunities and disruptions. After all, thematic investing is about investing with a purpose.


  19. Fertilizer Sector on Fertile Ground in 2022

    Fertilizer prices have considerably increased over the last year. Growth was driven by higher demand on account of

      to read | words

    Fertilizer prices have considerably increased over the last year. Growth was driven by higher demand on account of economic recovery in 2021 after the pandemic, jump in raw material prices (especially for natural gas), ban on exports by major producers such as Russia and China, and geopolitical tensions.

    Fertilizers play a crucial role in meeting food demand and are used worldwide as a supplement providing  essential nutrients to crops, thus increasing crop yield. Although they are available naturally, synthetic  fertilizers are much widely used due to their easier availability, lower cost, and greater yield. Among these,  nitrogen-based fertilizers account for nearly half of the global fertilizer consumption, with the rest made up  by phosphate- and potassium-based fertilizers.

    The price of fertilizers is determined by macro-economic factors, mainly demand and supply. Demand for fertilizers differs in each country and depends on several factors including population and food production, fertilizer inventory, and farming and application season. Supply depends on a fertilizer company’s capacity and ability to manufacture and sell fertilizers. The cost of raw materials and other overhead charges also impact the manufacturer’s ability and willingness to supply fertilizers to the market. Furthermore, the demand and supply of fertilizers is determined by country-wide policies including export quotas and domestic requirements. 

    Fertilizer prices reach record high

    Fertilizer prices have risen over the last year and continue to follow an upward trajectory. In February 2022, prices of urea went up by 122.1% yoy, muriate of potassium (MOP) by 93.5% yoy and diammonium phosphate (DAP) by 41.3% yoy to USD744/mt, USD392/mt and USD747/mt, respectively.

    Source: Bloomberg: World Bank Commodity Prices

    The rise in demand as opposed to supply shortage had led to the notable hike in fertilizer prices. Demand continued to remain strong after bouncing back from the pandemic-induced slowdown. Moreover, the rise in commodity prices at the start of 2021 prompted farmers to cultivate more crops and boosted demand for fertilizers in 1H21 (vs 2020). However, the shortfall of fertilizers witnessed in 2H21 continues to grow significantly.

    High fertilizer manufacturing costs hinder supply

    Another reason for the supply shortage was the increasingly high cost of raw materials used to manufacture fertilizers. Natural gas is the key input (feedstock) in producing urea and represents ~80% of the variable cost of production. Globally, the price of natural gas began rising in July 2021 and peaked at USD6.54 (USD/Mbtu) in February 2022.


    Source: Bloomberg: World Bank Commodity Prices


    The surge in natural gas prices globally was driven by its shortage. Russia fulfils almost 40% of Europe’s natural gas needs. However, in 2021, it failed to meet growing demand in Europe after the pandemic, as Russia reduced exports to the region by 25% in 4Q21 vs 4Q20. The dual energy policy and shortage of power supply led to higher-than-usual demand for natural gas from China as it is making a conscious effort to move away from coal-fired power plants. Moreover, Hurricane Ida that hit the US in August 2021 had a devastating effect on the country’s gas production as several large fertilizer companies had to halt production.

    On the other hand, demand for natural gas remained robust globally. Strong demand from Latin America and Asia as well as winter-related demand for heating further boosted natural gas requirement, pushing up its prices.

    The prices of other fertilizer raw materials, including nitrogen, nitrates, phosphates, potash and sulphates, rose substantially. The US Producers Price Index for nitrogenous fertilizer climbed up 114% yoy in February 2022 to USD696/mt.


    Source: Bloomberg

    In response to the high cost of production, European fertilizer makers, including  Yara International and  Borealis, announced production cuts. Yara International stated the output of ammonia and urea at its European facilities would be just 45% of capacity in March 2022, as producing fertilizers at the current high gas price and selling these later may be economically risky. Yara International had earlier implemented similar production cuts in September 2021 due to the burgeoning gas prices in order to maintain its margins.

    Profitability  for fertilizer companies vary despite high revenues

    Riding on the coattails of high product prices, fertilizer manufacturers reported strong Q421 revenues. Manufacturers well equipped to manage their input costs showed good performance, translating high revenues into high profitability. As shown in the chart below, European fertilizer manufacturer Yara International struggled with profitability in 2H21 despite robust revenues, mainly due to high production costs. In contrast, Middle Eastern firms such as SABIC Agri-Nutrients, the fertilizer segment of Industries Qatar and US-based CF Industries recorded significant profits in line with 2H21 revenues as their margins were well managed.


    Source: Company websites

    Source: Company websites, *CF Industries 3Q21 net income adjusted for asset impairments; **Industries Qatar figure represents segment profit


    Analyst expectations and stock prices

    With fertilizer prices reaching multi-year highs, analysts have been revising their financial estimates for fertilizer manufactures to reflect the positive momentum of prices on companies’ profitability (illustrated below).


    Source: Bloomberg

    Source: Bloomberg


    Fertilizer companies that optimised the effect of fertilizer prices on their profitability were well appreciated by the market. The stock prices of companies such as SABIC Agri-Nutrients and CF Industries that are operating in favourable market conditions have doubled since a year ago in line with their profitability. Yara International, however, only witnessed a nominal increase in prices, reflecting the negative impact of gas supply shortage in Europe on its business despite higher revenues.


    Source: Company Website, Reuters


    In addition to individual fertilizer-linked investment ideas, agri-nutrient ETFs are another option for investors to consider.

    Current market dynamics limit fertilizer supply amid geopolitical tensions

    Russia, China and Canada are the largest fertilizer exporters, together representing 35% of global exports. Russian fertilizer exports accounted for roughly 13% of the global output in 2020. In December 2021, Russia announced restrictions on nitrogen and phosphate fertilizer exports for six months in response to the market situation. Furthermore, after Russia invaded Ukraine in February 2022, several foreign logistics companies suspended cargo shipments to and from Russia in order to comply with the imposed sanctions. In response, the Russian ministry recommended fertilizer producers to temporarily suspend shipments until the logistics carriers resume regular operations and provide guarantees that the exports will be fully completed. The absence of Russian exports has aggravated the already constricted supply of fertilizers.

    China also suspended fertilizer exports until June 2022 to ensure domestic availability. As the country exports considerable quantities of DAP and urea, their absence has made the supply situation worse.

    Belarus contributed ~18% to global potash production in 2020 through its state-owned arm JSC Belaruskali. The US, UK, EU and Canada imposed sanctions on Belarus in December 2021 as a punitive action against human rights violations, which created a migrant crisis at Belarusian borders. In March 2022, the sanctions were significantly expanded due to Belarus’ role in supporting Russia in the ongoing conflict with Ukraine, further tightening fertilizer supply.

    In light of the geopolitical tensions with Russia, the initiation of the new Nord Stream 2 pipeline laid to supply Russian gas to Germany (completed in September 2021) is uncertain.

    Thus, the current market dynamics provide a favourable ground for fertilizer prices to stay buoyant in the near term. However, there could be a risk of price correction in fertilizers if natural gas prices normalise sooner than expected, thereby lowering manufacturing costs. Additional capacities of fertilizers scheduled to go onstream in 2022 could potentially increase market supply and exert downward pressure on prices.

    Fertilizer manufacturers that control their production levels, exports, pricing, and costs base efficiently would be well positioned to maximise profitability amid exponentially high prices.


  20. Metaverse – The Future of Internet

    Currently, metaverse is the one of the most exciting technologies in the tech space. Giants such as Meta

      to read | words

    Currently, metaverse is the one of the most exciting technologies in the tech space. Giants such as Meta and Microsoft have already started developing their own version of it. To a large extent, ‘the metaverse’ is what the internet meant in the 1970s. Although some may have an idea of what it is and which companies are investing in the idea, many are unaware of this concept.


    What is Metaverse?

    A metaverse is the result of the evolution of social connection and interaction. It is a digital world that combines VR, AR, IoT, 3D holographic projections, video, and other means of digital communication. People can traverse in this universe using digital avatars and connect/interact with each other. As the metaverse develops, it would provide a hyper-real alternative universe for users to coexist.

    Tech enthusiasts and experts envision metaverse users to play, work, and stay in touch with people for everything from conferences and concerts to virtual trips around the world. The metaverse must, however, become a collective project that goes beyond a single company. It should be created by all companies and be open to everyone.

    The metaverse has an initial infrastructure in place. The current technology can host hundreds of users in a single instance of a server, but future versions could handle thousands and even millions of users. The metaverse also involves motion tracking, which can suggest where a person is looking or where their hands are. This new technology is highly futuristic and will have many new applications and features.

    Figure 1: How Metaverse Works


    Unlike many VR apps, the metaverse is not a single software platform that can be built with the usual agile development model. Rather, it is a complex online virtual environment that relies on seven distinct layers/verticals.

    • Decentralization: This involves use of AI, blockchain, edge computing, and other decentralization tools.
    • Infrastructure: This includes connectivity technologies including Wi-Fi, 5G, and hi-tech materials such as GPU and cloud.
    • Human interface: This consists of AR/VR glasses and headsets, haptics, and other technologies that will allow users to experience the metaverse.
    • Creator economy: This refers to a collection of digital assets, ecommerce establishments, and design tools.
    • Spatial computing: This involves 3D visualization, hybrid gears, and modeling frameworks.
    • Experiences: This involves VR counterparts of digital apps for events, work, gaming, shopping, etc.
    • Discovery: This includes ads, social media, ratings, reviews - the content engine driving engagement.

    Companies building metaverse

    More than 150 companies are operating across the seven verticals and collaborating to build a metaverse. However, Meta (formerly Facebook) has stated the metaverse will not be owned by a single company. Multiple corporations, independent developers, and grassroot creators will team up to build it. Bloomberg Intelligence estimates the metaverse market size at USD800 billion by 2024. A few companies have already begun investing strategically in this direction with the aim of developing a metaverse.

    Meta Platforms Inc. (FB):

    Meta Platforms is developing technologies that will allow people to connect and explore the metaverse. It plans to invest USD10 billion in Facebook Reality Labs, its R&D arm tasked with creating AR and VR hardware, software, and content. It will invest another USD150 million in AR/VR training and resources to help developers, creators, and learners build new skills and expertise, access technologies, and unlock opportunities. Meta has most of the seven infrastructural elements required to build the metaverse.

    The company is collaborating with luxury sunglass brand Ray-Ban to develop smart sunglasses with built-in headphones and cameras, which will allow users to listen to music, make calls, and take photos and videos. Facebook Reality Labs has developed haptic gloves that use air pockets to enable users to “feel” virtual objects, a technology not developed by any company so far.

    Meta expects to have the required capital to build digital technologies and tools for the metaverse, courtesy of its social media platforms: Facebook, Instagram, WhatsApp, and Messenger. Such large capital injections will allow Meta to work on bringing the metaverse to life while keeping investors satisfied.

    Microsoft Corporation (MSFT):

    As companies seek to develop a metaverse, Microsoft may already have many of the necessary tools and capabilities. Most of the company’s existing technologies and platforms are in line with its vision of the metaverse.

    Microsoft plans to align its cloud and business productivity services with the metaverse and cater to a variety of use cases. It is developing a mixed reality platform, Microsoft Mesh, and cloud services, Microsoft Azure.

    Microsoft Mesh is being integrated with Microsoft Teams, which will allow users to collaborate virtually while working remotely. Microsoft Azure will provide the essential tools that would enable users to create digital simulations of real-world objects to drive innovation and design cost-effective planning.

    Microsoft is already a key investor in Roundhill Ball Metaverse ETF (META), a fund focused on companies involved in creating the metaverse. The case studies for Microsoft’s metaverse are diverse and range from remote work and productivity software to profits in gaming platforms in the near term to entertainment capabilities from its VR platforms in the long term.

    In January 2022, Microsoft announced its plan to acquire video game giant Activision Blizzard in a USD68.7 billion all-cash deal, which would be its largest acquisition to date. The acquisition is expected to provide the building blocks for the metaverse, making Microsoft a leader in the tech sector.

    Epic Games:

    Epic Games, the American video game company behind the popular immersive game Fortnite, is perfectly positioned to build the metaverse. The company is witnessing rapid adoption of its metaverse tools by enterprises and consumers. Epic Games raised USD1 billion dollar in funding in 2021 to drive the development of its metaverse platform. Epic Games has become a front-runner in creating the metaverse owing to the vast number of millions of users who log into Fortnite every month.

    Apple (AAPL):

    Apple has not made public announcements regarding its plan to develop the metaverse. However, analysts and industry experts suggest Apple is building a metaverse for its mixed reality headsets. Apple and Meta could have very different approaches to the digital world. Apple is not expected to follow the path everyone is taking but create a new one instead. Its VR/AR headset will be focused on “bursts of gaming, communication, and content consumption.”

    Niantic:

    Niantic developed Pokémon Go in 2016 in collaboration with Nintendo and The Pokémon Company. This game was among the first immersive experiences, blurring the lines between real and virtual. Niantic is building a metaverse that is in line with what rivals such as Snap and Meta are pursuing. From the beginning, Niantic has had all the makings of a metaverse company. It recently raised USD300 million to build its own metaverse, an alternative to the original notion of the metaverse as a “dystopian nightmare.”

    Nvidia Corporation (NVDA):

    Nvidia provides a crucial hardware component without which metaverse applications cannot operate GPUs. Hence, the company is expected to play a critical role in this industry. Nvidia offers semiconductors with lightning fast responses as required by the metaverse. It is already benefiting from increased investment in this space, boosting demand for its semiconductors. Further development will improve the bottom line, profiting stockholders in the form of dividends and higher share price.

    Nvidia plans to develop Omniverse, a platform aimed at sharing, development, and productivity services designed to help provide metaverse experiences, a potential growth driver for the company.

    Roblox Corporation (RBLX):

    Roblox is an online game platform and game creation system developed by RBLX. The company is taking a different approach to metaverse development. While some players are developing their own hardware and services, RBLX is giving businesses the opportunity to create virtual experiences tailored to their needs. The company could gain a competitive advantage and become a market leader in this area.

    Roblox is one of the most successful players in the metaverse market. Almost 50% Americans below 16 years played Roblox in 2020 and the company’s user base continues to grow rapidly. The Roblox platform has over 40 million games, 9.5 million developers and, as of the third quarter, 47.3 million average daily active users.

    Unity Software Inc. (U):

    If the metaverse is like a Ready-Player-One-style galaxy of virtual places, games, and experiences, no company might be as well positioned to deliver it as Unity. The company is uniquely positioned to capture revenue streams from building the digital infrastructure of the metaverse and participating in the NFT economy. Metaverse development will generate new revenue streams for the company to develop digital infrastructure beyond the gaming vertical. Unity recently acquired Peter Jackson’s VFX studio, Weta Digital, for over USD1.62 billion. Following the acquisition, Unity seems well placed to capture new revenue streams in the metaverse.

    Conclusion

    The idea of a metaverse is truly exciting, as the technology has no limits. It showcases human brilliance and our ever-exceeding capability to create. The metaverse is already here in some form or the other and we are living in it subconsciously. If you have used VR headsets to play video games or been on a virtual tour of a university you are applying for or even bought a pair of sunglasses from Lenskart after trying it online, then you have experienced the metaverse on a small scale. However, the metaverse is focused on integrating these technologies and experiences into one platform. Considering recent investments by technology companies, we will soon be living in a world where the metaverse is a reality, allowing users to indulge in a digital virtual experience and thus shaping the digital future.


  21. Energy Crisis Unfolding in Europe

    These are unprecedented times for the energy market in Europe. While the energy sector is taking steps to

      to read | words

    These are unprecedented times for the energy market in Europe. While the energy sector is taking steps to decarbonize, renewable resources are increasingly contributing to the generation mix as the demand for electricity grows. The financial burden on industries, including the metal and fertilizer sectors, is mounting, with energy costs breaking new records daily. In January 2022, 30% of the France’s nuclear capacity is estimated to go offline, further increasing its reliance on gas, coal, and even oil to keep the lights on. Mild winter have saved the EU so far in December. However, in case of supply disruptions or extreme cold, securing energy supply may threaten economic recovery and may force factories to shut down to protect people from freezing in the dark.

    Europe is on the verge of an unprecedented energy crunch. The gas price at the Dutch TTF hub, known as the benchmark of gas price for Europe, soared to 165 euros per megawatt-hour in December 2021, which is a new record high. Brent crude currently stands at $84 per barrel, close to its five-year high, while spot natural gas prices are up more than 500% YoY. This has hindered the EU’s plan to transition toward green energy and switch back to the highly polluting gas-to-coal. Shortage of natural gas, decline in wind power output, cold weather, and nuclear outage have driven electricity prices across Europe. France, which usually exports power, now seeks imports and has restarted its fuel burning generators. In Greece, the average monthly wholesale prices stood at €203.83/MWh as of December 2021, the highest in Europe. The average monthly wholesale prices in France and Germany stood at €178.06/MWh and €159.38/MWh, respectively. 

    Average electricity wholeseale prices (in euros per MWh)

    Source: Statista


    What caused the sudden surge in prices?

    1. Recovery in global demand
    2. In 2020, the pandemic drove energy demand and prices to a historic drop as the world came to a standstill. However, as economies started to open in 2021, countries are finding it difficult to fulfill the sudden surge in the demand for energy. That was partly because of the changes in energy use during the worst phases of pandemic disruption. According to the International Energy Agency (IEA), the global gas demand is said to recover 3.2% in 2021, erasing the losses in 2020 and pushing demand 1.3% above the 2019 level.

    3. Over reliance on imports
    4. The EU has always been over reliant on imports to match the ever-rising demand in the continent. Europe’s energy dependency rate stood at 60.7%. As of 2019, 27% of the crude oil and 41% of the natural gas was imported from Russia. Through the Nord Stream pipeline, the EU receives natural gas directly from Russia. However, Russia recently reduced the number of shipments, citing seasonal change to divert more natural gas into storage caverns to prepare for steep domestic demand during the winter. The law states that domestic demand should be fulfilled before exporting natural gas. This led to a surge in prices amid shortage concerns.

      EU energy import dependency

      Source: Eurostat


    5. Insufficient renewable sources
    6. In 2020, renewable energy contributed about 22.1% of the total energy consumed in the EU. Although the number is ever increasing, renewable power in the bloc is insufficient at present. At night, solar power generation stops, and lower wind speed leads to wind power failure. Europe’s main carbon neutrality program impelled member states toward short-term pricing and away from long-term purchase agreements, making the crisis more costly. Transition to renewable energy is important, but it is not yet proven to be sufficiently scalable to meet rapidly rising demand.

      Production of primary energy by fuel type, EU

      Source: Eurostat


    Current Scenario

    In the coldest months of the year, Europe faces an energy crisis. Germany stated that Russia’s Nord Stream 2 pipeline will not be approved in the first half of 2022, a move that is likely to keep supplies limited in the summer when Europe needs gas to fill storage sites.

    In October 2021, a spike in the prices of natural gas in the United Kingdom compelled some industrial companies to cut production and seek state aid. Considering the neighboring countries would want to protect supplies for households, it could mean energy usage allowance being reduced. Nuclear power generates most of France’s electricity (more than 70% of its total electricity) and is a major exporter of electricity to neighboring countries and the UK. In France, two nuclear power plants were stopped in early December, raising the total number of nuclear plants out of operation to four, which accounts for 13% of the current power availability in France.

    Total energy production and consumption for 2020 (in million tons)

    Source: Enerdata: Global Energy Statistical Yearbook 2021


    Mild winter saved the EU, but threat persistent

    As the temperature starts to drop in Europe, energy prices are repeatedly breaking records and expected to worsen. Europe’s second biggest economy, France, is particularly at risk. For the country’s grid operator, the possibility of chill in January and February 2022 is a major concern. The availability of nuclear stations is also low following the pandemic due to delay in the maintenance of some reactors. However, mild weather thus far has reduced the panic in the European market, with Zurich and Frankfurt being even warmer at 13 degrees Celsius compared with their standard level temperature. The effects of crisis would reverberate in Germany, Spain, Italy, and Britain as France is a key exporter of electricity to these countries. Due to a blistering rally in natural gas prices, the situation is already severe this winter. Fuel stores used to generate electricity and heat homes are rapidly depleting and gas stores could drop to zero if the freezing weather boosts demand.

    The long-awaited start of the Nord Stream 2 pipeline to Germany from Russia would alleviate the continent’s energy crunch. The project has been completed, but considering the regulatory hurdles, it is unclear when the flow will start. If the pipeline bringing natural gas to Europe from Russia, bypassing Ukraine and Poland, is fully operational soon, most supply issues could be resolved. Gas is cheaper during summer and companies are taking advantage of it to store it in large volumes and be well prepared before winter. But the ongoing price crisis has disrupted the custom, and the current reserves are historically low this time of the year, a threatening sign for the coming months. While Europe as a continent relies heavily on Russian gas, forecast of a colder winter would weaken Europe’s energy sector and national security, leaving Russia undeterred.

    EU resorting to conventional energy to stave off energy crisis

    As we move into 2022, the energy crisis is only getting worse. In what looks like a desperate attempt, the EU has proposed to label nuclear gas as “green.” A draft for the taxonomy, which is a labelling system for economic activities deemed “green” was issued in the closing hours of New Year’s Eve. According to the draft, nuclear power plant investments could be labelled green if it is a “transitional” fuel and receives permit before 2045. Gas power plants could also be labelled green if they replace a more polluting fossil fuel source such as a coal power station, receive a construction permit before the end of 2030, and emit less than 270g of CO2 equivalent per kilowatt hour. France supports the proposal, as nuclear energy is its main source of energy. However, Austria, Denmark, Luxembourg and Spain continue to oppose the inclusion of natural gas and nuclear in the EU’s sustainable finance taxonomy. To prevent the inclusion, at least 20 EU member states (representing at least 65% of the population) need to collectively reject the proposal, which appears unlikely. Passing of this proposal will help transition from fossil fuel sources to renewable sources, thus ensuring Europe’s energy security in the long term.


  22. Impact Investing in Real Estate

    Amid the requirement for a robust social infrastructure in the wake of the pandemic, social impact investing is

      to read | words

    Amid the requirement for a robust social infrastructure in the wake of the pandemic, social impact investing is increasingly attracting attention. While issues such as climate change continue to pique the interest of investors, social investing is also gaining momentum. Being less vulnerable to market dynamics and falling in the category of sustainable investments, social impact investing may soon feature as a product in the portfolios of investors.

    COVID-19 exposed a lot of systemic cracks in infrastructure, indicating the overall inability to deal with a global crisis of that level. One such issue is the absence of social infrastructure worldwide, which comprises health care, education facilities and affordable housing. With many countries lacking these necessary facilities, the level of the disaster, in terms of sickness and mortality rates, was shockingly high.

    A look back at the last decade, investments in the social infrastructure domain in several large OECD countries declined notably in 2010s.


    Source: OECD, Franklin Templeton, Aranca Analysis
    Note: Australia did not report numbers for 2017-2018; Japan did not report numbers for 2016-2018


    Inadequate real estate infrastructure was an issue before COVID-19 as well; the pandemic only exacerbated the challenge, showing more than ever the need to increase investment in such areas. Social infrastructure is not just indispensable but a large-scale opportunity too for both institutional and private investors. While returns are competitive, there is scope to align the portfolios with the ESG norms, implying relevance from the sustainability perspective. 

    So far, government spending as well as investments in social infrastructure, even amid the pandemic, have been far short of sufficient in most nations. This underscores the importance of increasing private sector participation in this segment.

    As the world transitions from the thinking-out-loud phase of ESG commitments, to following up with action and data, social infrastructure is emerging as an attractive alternative for private investors. Financing methods outside the traditional public sphere can significantly transform the sector.

    Source: Aranca Analysis


    Impact investing is about directing capital and deploying the same sustainably in organizations that generate social and/or environmental benefits. The outcome for the society is positive, besides of course the strong returns on investment. Intentionality, measurability, and additionality of funds are the main components of impact investing. It covers all asset classes, the most used being private equity, private debt and real asset instruments.

    Source: OECD, Aranca Analysis


    One of the biggest themes under impact investing is climate change. Another emerging aspect is the social angle, with quality healthcare, education and affordable housing on top of the minds of investors. The rationale for investing is typically driven by what asset owners focus on and engage in. Impact investing differs from other forms of investing such as environmental, social, and governance (ESG) and socially responsible investing (SRI). ESG focuses on how the company’s environmental, social, and governance practices impact society, positively and negatively. Socially responsible investing entails actively selecting or removing investments based on specific values, standards, and ethical guidelines. For instance, an investment fund may choose to avoid investing in companies that operate in addictive businesses such as alcohol, tobacco, and casino/gambling. Impact investing pays importance to the measurable societal and/or environmental benefits generated from investors’ capital alongside financial returns.

    Social infrastructure investments are attractive to long-term investors due to the scope for dual return: a market-rate financial return that comes from long-term inflation-linked lease contracts; and impact return, which is the quantifiable mechanism for the improvement achieved in the quality of life. Social infrastructure investments often give predictable, steady returns, and are less exposed to market risks. Cash flows are usually guaranteed to a large extent by contract. These contracts are long term in nature and provide owners predictable, steady, and stable cash flows, thus providing a sense of security on income. Social infrastructure investments offer minimal exposure to economic cycles as well, as they are deemed essential and operate throughout.

    Source: Franklin Templeton, Aranca Analysis


    While the pandemic did send major parts of the world into lockdowns, it also highlighted the importance of resilient and sustainable healthcare and educational systems. Social infrastructure is vital to the health, robustness and vibrancy of communities, and the crisis has rendered these assets indispensable. Consequently, the demand for capital to be deployed toward impact investing is more than ever before, which has increased the perceived value of sustainable assets.

    As much as the pandemic has slowed economies across the globe, including real estate activity, the flip side of it is the wake-up call for investors to prioritize investments in sustainable infrastructure and assets.


  23. Global Semiconductor Chip Shortage – Extending to 2022

    Semiconductors are the foundation of everything digital in today’s world – from transportation and AI to 5G, quantum com

      to read | words

    Semiconductors are the foundation of everything digital in today’s world – from transportation and AI to 5G, quantum computing, and beyond. The worldwide shortage of semiconductors that began in late 2020 emphasized the criticality of these specialized components. Although the industry faced severe supply challenges before the pandemic, the restrictions and lockdown imposed across the globe fueled the shortage. This situation has affected the automotive industry and electronics market the most. Some of the world’s leading auto manufacturers and technology companies are developing strategies to resolve this issue, while semiconductor manufacturers across the globe aim to ramp up production to meet the exceeding demand.

    Introduction

    With technology advancement across several sectors, semiconductors are literally the “heart” of billions of products, ranging from smartphones, computers, data centers, household appliances, laptops, tablets, smart devices, vehicles, life-saving pharmaceutical devices, ATMs, agri-tech equipment, and more. We are now in a world where every industry is either enabled by or dependent on semiconductors. Digitization drives the continued need for more chips, assisted by the four superpowers of AI, ubiquitous computing, cloud-to-edge infrastructure, and pervasive connectivity.

    Figure 1 – Everyday products that rely on microchips


    Case study – Auto Industry

    Semiconductors are important components in the manufacture of automobiles and mainly used for power management, vehicle control, sensing, displays, and safety features. The acute shortage of semiconductor chips negatively affected global vehicle production in 2021 and is likely to extend to 2022, leading to huge losses for the auto industry. The global auto industry may produce 9.4 million to 11 million fewer vehicles in 2021 due to this shortage. As a result of the ongoing supply disruption, several vehicle manufacturers are likely to face difficulties until the second half of 2022. The chip shortage has negatively impacted vehicle delivery, leading to delays across the supply chain. In addition to delays in vehicle delivery, global carmakers have started discarding some features and high-end electronic components temporarily to cope with the chip shortage.

    Figure 2 – Global Integrated Circuit (IC) unit shipment across various downturns, quarterly, 1990 to Q2 2021 (log scale)

    Source: Deloitte analysis based on secondary research and data gathered from publicly available articles and reports.


    Causes

    The demand for microchips exceeded supply even in the pre-pandemic era. The spread of COVID-19 globally created the perfect storm for the semiconductor industry, resulting in a severe supply crunch. First, as the global stay-at-home orders and lockdowns resulted in unprecedented usage of smartphones, laptops, and streaming devices, the already excessive demand for chips shot up. Second, the worldwide shutdown of production facilities halted chip production temporarily. Finally, massive supply chain bottlenecks were witnessed, as some major ports across the world ceased operations. The global chip crisis is a combination of various events, with the snowball effect of the pandemic being the primary reason, followed by the US–China trade war and drought in Taiwan. The semiconductor shortage was not caused by a single incident or event; rather, a series of events contributed to this situation.

    Struggles during the COVID-19 crisis

    Demand in the auto industry dropped substantially in the first half of 2020. Moreover, while new vehicle sales improved in the second half of 2020, the highly unclear sales outlook at the time meant that automakers did not meaningfully increase their semiconductor orders. At the same time, the shift to remote working and the associated greater need for connectivity significantly drove consumer demand for servers, PCs, laptops, and equipment for wired communications, all of which considerably depend on semiconductor chips. Even as the auto industry significantly reduced chip orders, other markets encountered an increased need.

    Lack of new capacity

    In recent years, the semiconductor industry has matured and achieved greater scale through consolidation. Although the capacity has expanded steadily, the industry witnessed an average annual growth of around 4% in line with sales. In the last decade, semiconductor utilization was constantly high at or above 80%. The utilization rate in 2020 reached around 90%, which many industry leaders regarded as full utilization, since exceeding that level often results in excessively long lead times. While the semiconductor industry increased its production capacity by nearly 180% since 2000, its total capacity remains nearly exhausted at the current high utilization rate.

    Geopolitical tension

    The global chip crisis and geopolitical tension with China have shifted the focus back to the semiconductor industry. The US wants to reinstate its leading position in chip manufacturing. Under the leadership of President Joe Biden, the US aims to reduce its dependency on chipmakers based in Asia by looking for ways to bring manufacturing back to the US. The industry has its eyes set on the increasing tension between China and Taiwan amid the global chip crisis.

    As a result of geopolitical tension, some consumer-electronics manufacturers significantly increased their stock level of chips to sail through a period of limited access to chip manufacturing. McKinsey & Company reported that such stockpiling caused a rise in semiconductor demand of 5% to 10% in the wireless market, which is equivalent to one-third of the auto-market chip sales.

    Contract terms

    The standard contracts for procuring parts in the auto industry are significantly different from other industries, as they are more often governed by long-term binding agreements, also termed take-or-pay deals, and provide semiconductor manufacturers purchase orders beyond 6 to 12 months. Amid a highly complex and heavily outsourced auto supply chain, the chip-sourcing commitment cycle for the auto industry tends to be short term, especially for binding purchase commitments on the order of a few weeks to a few months. Semiconductor manufacturers are now dedicated to traditional, long-term contracts from other fast-acting industries, although the auto industry has had a good standing for steady demand in the past.

    Limited stock

    Just-in-time manufacturing practices are widely leveraged in the auto supply chain, as they can increase efficiency and minimize waste by maintaining low inventory levels. Companies may benefit financially because of reduced inventory levels in regular business conditions. However, in the event of an unexpected shortage, this practice may immediately disrupt the entire supply chain. Many players across industries had a highly limited stock of chips to survive the crisis, as most failed to predict the chip shortage.Just-in-time manufacturing practices are widely leveraged in the auto supply chain, as they can increase efficiency and minimize waste by maintaining low inventory levels. Companies may benefit financially because of reduced inventory levels in regular business conditions. However, in the event of an unexpected shortage, this practice may immediately disrupt the entire supply chain. Many players across industries had a highly limited stock of chips to survive the crisis, as most failed to predict the chip shortage.

    5G rollout and overlapping chip demand

    The demand for semiconductors differs by node size in the industry. The most advanced chips in small ranges are 14 and 7 nanometers or smaller. These are increasingly used in several leading-edge technology applications but not particularly required by automakers. An expansive rollout of 5G services warrants a huge number of radio-frequency semiconductor chips and large node sizes as auto chips. This also holds true for power-electronic chips needed to boot up PCs and servers. This amount of overlap implies that as the 5G rollout occurs over the next few years, auto manufacturers might face an ongoing shortage of chips.

    Figure 3 – Surging Demand for EVs, 5G Smartphones and PCs is Driving Chip Demand 

    Annual shipment of devices including growth rates

    Source: S&P Global Ratings


    Industries Impacted

    More than 150 industries have been impacted by the chip shortage, but some have been hit much harder than others. The global semiconductor shortage has affected several industries for over a year now. Resultantly, industries are presented with two options: paying more for a product and getting it considerably faster or waiting a little more and getting products at the market rate. The shortage has affected the production of several household appliances, smartphones, laptops, printers, gaming consoles, PCs, automobiles, airplanes, and medical devices, among others.

    Auto Industry

    The auto industry accounts for around 10% of the global semiconductor sales. The chip shortage has severely impacted some of the biggest names in the industry, including Tesla, Ford, General Motors, and BMW. About 17 car manufacturers in North America and Europe have slowed or stopped production due to lack of chips. Amid the semiconductor supply shortage, the global auto industry is expected to witness a loss of $60.6 billion in revenue in 2021 and faces an estimated overall loss of $210 billion in revenue.

    Consumer Electronics and Household Appliances

    Similar to the auto industry, the global chip shortage will have a fundamental impact on the consumer electronics segment. The shortage of chips could not only lead to lower supply of electronic goods but also trigger an increase in prices. The demand for consumer electronics such as smartphones, laptops, and desktop PCs rose throughout the pandemic due to the switch to virtual learning among students and rise in remote working. While the global chip shortage is pushing up prices of laptops, printers, CPUs, and gaming consoles, production of top-selling devices, including smartphones and household appliances such as microwaves and refrigerators, also fall prey to the global chip shortage. HP is expected to increase the price of its printers by almost 20%. Sony has also hinted that it will not produce enough supplies of the PlayStation 5 console going forward in 2022.

    Data Centers

    During the pandemic, most chip fabrication companies such as Global Foundries, Samsung Foundries, and TSMC prioritized high-margin orders from PC and data center customers. While this has given data centers a competitive advantage, it is unfair to say that data centers have not been affected by the chip shortage. Data centers have struggled to source some components such as capacitors, BMC chips, circuit boards, and resistors, which are required to put together their data center switching systems. The chip shortage has led to several challenges for data centers, including reduced assembly capacity and extended lead times due to substrate and wafer shortage.

    LED & Lighting Fixtures

    The chip shortage also affected LED supply, and the demand for smart homes slightly declined as the pandemic slowed down or even stopped construction, remodeling, and improvement for residential and commercial properties.

    Current Situation

    The crisis appeared to ease during August 2021, but the situation is beginning to worsen. Smartphone manufacturers have been relatively protected thus far as they had existing stock of chips. However, the pressure is building on them and they too are starting to suffer. Gaming consoles, including the newly launched PlayStation 5 and Xbox Series X, have been in short supply. Foundries are increasing wafer prices, resulting in chip manufacturers raising device prices.

    The global semiconductor demand remained high in October, with y-o-y sales increasing substantially across major regional markets. In November 2021, the Semiconductor Industry Association (SIA) reported global semiconductor sales of $144.8 billion for Q3 2021, an increase of 27.6% over that in Q3 2020 and 7.4% more than that in Q2 2021. With the industry aiming to ramp up chip production, the highest number of semiconductor units were shipped during Q3 2021, a milestone compared with that in any other quarter in the market’s history.

    As the situation stands, the global chip crisis still persists. Prices of many electronic goods and components are expected to rise 1% to 3%. The global chip shortage has deteriorated in the last few months, with more than 8.2 million vehicles already taken out of production. The total reduction for the full year is estimated between 9.4 million to 11.0 million.

    The chip shortage is disrupting auto businesses across the value chain as OEMs and their suppliers seek alternate ways to procure reliable chip sources. As semiconductor manufacturers struggle to keep up with the demand and auto players debate their next move, both the industries must align their short- and long-term strategies to withstand the supply-chain disruption. The demand surge and supply constraints causing the shortage are not one-off events. The fierce competition for chips and rising demand for electronics persist.

    Companies such as Qualcomm and Apple design their own chips using the advanced ARM architecture software but outsource manufacturing to companies such as Taiwan Semiconductor Manufacturing Company (TSMC), the largest contract manufacturer for chips in the world. Recently, Intel outsourced some manufacturing to TSMC amid the chip shortage.

    Prospects for recovery

    It is highly unlikely that the global semiconductor shortage will resolve in the short term, mainly because of factors such as the increasingly sophisticated chips needed in auto design and complexity of semiconductor manufacturing. As a result, OEMs might have to consider some short- and long-term strategies as businesses deal with the imbalance in semiconductor supply and demand.

    Short-term strategies

    In light of the current situation, the supply and demand imbalance for semiconductors shows no sign of settling in the short term. This is because the normal lead times for semiconductor production can go beyond four months for products already well established in an assembly line.

    Increasing capacity by moving a product to another manufacturing site in existing plants usually adds six months. Changing foundries or switching to a different manufacturer generally adds another year or more because the chip’s design requires modifications to match the specific manufacturing operations of the new partner.

    As the situation stands for the auto industry, chip capacity will not match demand in the short term. This is mostly because of the sustained increase in volume and sophistication levels of chips required to develop new technologies, such as autonomous driving and advanced driver-assistance systems.

    Some of the world’s leading companies have taken several measures to deal with the current situation. Many corporates have established dedicated war rooms that combine their supply and demand intelligence to create better transparency and develop strategies to tackle the issue. For example, automatically developed dashboards can combine data from multiple sources, such as a company’s supply chain and a semiconductor manufacturer’s commitments. The use of analytics to match demand and supply assists in overcoming the issue with an error-prone and cumbersome manual effort.

    Several auto manufacturers and tier-one suppliers consistently collect and analyze highly sophisticated intelligence on chip-manufacturing locations and semiconductor value chain. Company leaders try to reassess the competitive landscape regularly by weighing the technological applications for prioritization at the level of the individual chips required to make informed decisions.

    Solving long-term issues

    In the long term, it is important for the auto industry to rethink a way to change the structure of contracts for sourcing semiconductors. In this regard, a good starting point would be for OEMs and tier-one players to make binding up-front volume commitments. A more stable risk-sharing strategy aligned with the value chain might help drive adoption rates.

    Additionally, companies might have to reassess the current just-in-time delivery practices and low inventory levels across their value chains. Since many government leaders are now alarmed about the instability of supply chains and prospects of depending on a single supplier or distant countries for essential components, companies might need to align with government strategies that encourage regional sourcing.

    Companies can also opt to invest in supply-chain resilience, with a clear view of their reliance on selected components and supply uncertainties. These investments might range from regulating pricing levels with supply assurances to bundling volumes and achieving greater control in the negotiation process to spending on dual-source manufacturing qualification in cooperation with semiconductor suppliers.

    What Lies Ahead?

    The chip shortage is expected to continue until 2023 due to strained supply lines and long lead times in the semiconductor industry. With technology advancements in several industries and roll-out of 5G services, the demand for PCs, smartphones, consumer electronics, laptops, and other smart devices is projected to remain high over the next few years. In such a situation, retailers may find it increasingly difficult to cater to the skyrocketing demand and consumers may have to face the ultimate burden. Chip shortage is expected to continue in Q2–Q3 of FY22 and supplies are expected to improve in a staggered manner. 

    It is crucial that semiconductor manufacturing and other companies that require chips for their products take immediate action to develop a more robust supply chain for years to come. These steps help mitigate risks, minimize disruption to business operations, lay the groundwork, and set the stage for short- and long-term strategies requiring significant investment in resources and time.

    The pressure on capacity is likely to continue for some time. We will undoubtedly remain in a constrained environment given that the demand for semiconductors across the world is not slowing down. While the supply is expected to remain constrained, the demand is set to remain high, extending the shortage to last throughout 2022 and into 2023. IDC projects the semiconductor market to grow 17.3% in 2021 and reach potential overcapacity by 2023. Despite the current situation, the market is expected to reach $600 billion by 2025 and $1 trillion by the end of this decade.

    Figure 4 – Global Semiconductor Capacity: Percentage share by region, 1990 – 2025

    Source: Deloitte analysis based on information gathered from publicly available third party sources


    Figure 5 – More than 85% chip foundry capacity is concentrated in the APAC region 

    Worldwide foundry capacity share by region, 2021 (projected)

    Note: Others mainly include Europe, North America and Japan Source: Deloitte


    Conclusion

    In conclusion, the semiconductor chip shortage is as real as it gets and an issue for various industries, which ultimately leads to a weak economy. Everyone, including regular consumers, are affected. In the last few months, most brands have hiked car prices, and the prices of smartphones, even the budget variants, are increasing. In addition, GPU prices are considerably up and it is a bad time to build PCs. In simple terms, the crisis is far from over and might spread to other industries. The situation could normalize by 2023, but the world is still trying to get around the issue and find solutions and substitutes wherever possible.


  24. Will Mining Industry Retain its Shine in 2022?

    A sharp surge in commodity prices in 1H21 led to miners registering a substantial profit. Global economic recovery

      to read | words

    A sharp surge in commodity prices in 1H21 led to miners registering a substantial profit. Global economic recovery and strong end market demand supported the rise in commodity prices. Although prices have started to ease over the past few weeks, they are still higher than the 2020 and pre-pandemic levels. We believe recovery in the global economy, huge monetary stimulus by several central banks, and the US government’s plan to increase infrastructural spend would continue to boost the commodity prices in the near term. However, we do not expect miners to deliver record-high margins and profits in near term owing to greater exposure to iron ore commodity which is expected to remain weak in near term owing to supply normalization and lower demand from China.

    Top miners reported strong 1H21 earnings with record-high profits and EBITDA margins, led by an all-round rally in commodities. Growth was mainly driven by higher volumes and prices, coupled with cost-cutting measures. In 1H21, iron ore prices shot up 200.6% y/y, copper 162.9% y/y, thermal coal 157.4% y/y, and palladium 13.7% y/y. After a washout in 2020, pent-up demand mainly from China and recovery in key sectors (e.g., steel, construction, infrastructure), pushed up prices. Given its commendable performance in 1H21, the mining industry appears poised for robust growth in 2021.

    3Q21 sees return of volatility
    Despite the soaring commodity prices, growth has been uneven in 2021. Copper, platinum, palladium, and iron ore touched all-time high levels in May 2021. However, prices started declining thereafter due to the rapid spread of the delta variant of coronavirus, US Fed taper talks, and concerns over economic slowdown in China. Notably, iron ore prices plummeted 41.1% in October, after reaching the highest level in May 2021. This was largely ascribed to steel production cuts in China aimed at decreasing pollution and meeting year-end emission reduction targets of provincial governments. Moreover, platinum and palladium prices dropped 15.9% and 29.7%, respectively, in October, after reaching a record high in May 2021 due to disruption in the semiconductor supply chain. Conversely, aluminum, thermal, and cocking coal prices continued to surge and registered an all-time high in the same month amid an unprecedented rise in electricity demand (mainly from Asia), low inventory, and supply shortage. Most importantly, aluminum production consumes higher electricity, which was disrupted in China’s Yunnan province as a drought hit hydropower supply.

    Although prices have started to decline over the past few weeks, they are still higher than the 2020 and pre-pandemic levels. Based on Bloomberg estimates, most of the commodity prices are expected to increase by 2–4% y/y in 2021 and 2022, except iron ore, which would grow 52% y/y in 2021 but fall 29% y/y in 2022. We believe recovery in global economy, massive monetary stimulus by several central banks and US government’s intention of higher spending on infrastructure would continue to support the commodity prices in near term. According to IMF, global GDP is estimated to grow 5.9% in 2021, 4.9% in 2022, and 3.6% in 2023, suggesting continued recovery from the 3.1% degrowth in 2020. While China – a key market for miners – is expected to advance 8.0%, 5.6%, and 5.3% in 2021, 2022, and 2023, respectively, higher than 2.3% in 2020. Almost 50% each of BHP Group (BHP) and Rio Tinto (RIO)’s revenue and 30% of Anglo American plc (AAL)’s revenue come from China.

    We expect demand for copper to remain robust as it is one of the top renewable resources and focus on reducing carbon emission has increased worldwide in recent years. However, higher copper prices may not significantly benefit many of these miners since the metal contributes just ~20% each to total EBITDA of BHP and AAL and 10% in the case of RIO.

    Conclusion
    In the medium term, we do not expect miners to deliver record-high profits and margins, considering iron ore would remain one of the main commodities. Iron ore accounts for about 60% of BHP’s EBITDA, 80% of RIO’s, and 34% of AAL’s EBITDA. Iron ore prices are under pressure owing to supply normalization in Brazil, which was impacted due to disruptive weather and a dam bust in 2019, together with pandemic-induced travel restrictions worldwide in 2020. Although one of the biggest producers – Vale recently announced to curb its production, lower demand from China owing to steel production cuts ahead of Winter Olympics 2022 would continue to put pressure on iron ore prices in the near term. Furthermore, there is considerable uncertainty about which end market would recover faster, which government would provide more assistance, and how commodity prices would rise over the next 1–2 years. However, having a well-diversified portfolio would continue to benefit AAL, whereas BHP and RIO would have limited scope for improving earnings owing to greater exposure to iron ore.


  25. India as a Green Economy

    Green economy has recently emerged as a key concept on the global sustainable development agenda. Over the last

      to read | words

    Green economy has recently emerged as a key concept on the global sustainable development agenda. Over the last decade, India’s rapid growth has created job opportunities and helped improved the standard of living. However, its remarkable growth record is restricted by a degrading environment and depleting natural resources, which has necessitated taking major steps to achieve a green and decarbonized economy. COVID-19 has turned consumers' attention to a greener economy, prompting brands to resort to sustainability by default. Consequently, with the aid of the government and corporations, India must make the transition to a circular economy.

    Urbanization is a global phenomenon, but it is growing rapidly in developing countries such as India. A United Nations report shows that 60% of the global population would live in urban areas by 2030. Currently, Asia is home to 90% of the world’s rural population. However, the region is witnessing an exponential increase in urbanization, and its rate is expected to reach 56% by 2050.

    Emerging countries such as India have the potential to transform the economy by harnessing the opportunities offered by urbanization, mainly driven by the growing population and accelerated industrialization. However, this growth in urbanization is causing the climate to change drastically.

    Urban areas are responsible for the increasing levels of air, water and soil pollution. Excessive carbon emissions from cars in cities, spatial congestion caused by the urban sprawl, and groundwater depletion owing to overdevelopment and mismanagement are just some of the negative effects of over urbanization. Increasing population in large Indian cities not only puts a huge burden on the overall infrastructure and management of energy, water and transportation, but also has a hazardous effect on the atmosphere, and climate.

    India's Status as a Green Economy
    According to the 2020 Environmental Performance Index, countries around the world are ranked based on indicators such as waste management, air quality, biodiversity & habitat, fisheries, ecosystem services, and climate change.

    Among the top six largest economies, India ranked 169 out of 180 countries, indicating it lags in green growth. Individually, for some of the indicators India’s ranking are as follows: Air Quality (179), Sanitation & Drinking Water (139), Waste Management (103), Biodiversity & Habitat (149), Fisheries (36), and Climate Change (106).

    India’s poor performance is a cause for worry, with nearly 1.3 billion people facing serious environmental health risks.

    Countries

    Environmental Performance Score

    Rank (out of 180 countries)

    GDP Rank

    United Kingdom

    81.3

    4

    5

    Germany

    77.2

    10

    4

    Japan

    75.1

    12

    3

    United States

    69.3

    24

    1

    China

    37.3

    120

    2

    India

    27.6

    169

    6

    Source: Wendling, Z. A., Emerson, J. W., de Sherbinin, A., Esty, D. C., et al. (2020). 2020 Environmental Performance Index. New Haven, CT: Yale Center for Environmental Law & Policy. Indicators are weighed on a 0–100 scale, from worst to best performance.

    Potential Hurdles
    India is emerging as the one of the fastest growing economies worldwide. It is currently the sixth largest economy globally by GDP and the third largest economy in Asia. According to IMF, the global economy contracted considerably in 2020 due to COVID-19 but is projected to grow 6.0% in 2021 and 4.9% in 2022 driven by macro recovery. India’s GDP grew at a record pace of 20.1% to ₹ 32.38 lakh crore during April-June 2021 compared to the corresponding period last year. The World Bank predicts the Indian economy would advance 8.3% and 7.5% in 2021 and 2022, respectively. Key development indicators (KDIs) for India and some countries are listed in the table below.

    Table: KDI for India and some countries

    Countries

    GDP in USD Bn (2020)

    GDP per capita (USD)

    CO2 emissions (KT) (2018)

    CO2 emissions MT per capita) (2018)

    Net trade in goods and services in USD Bn (2020)

    United States

    20,936.60

    63,543.6

    4,981,300

    15.2

    (681.71)

    China

    14,722.73

    10,500.4

    10,313,460

    7.4

    369.67

    Brazil

    1,444.73

    6,796.8

    427,710

    2.0

    11.74

    India

    2,622.98

    1,900.7

    2,434,520

    1.8

    (8.22)

    Japan

    5,064.87

    40,113.1

    1,106,150

    8.7

    (6.20)

    South Africa

    301.92

    5,090.7

    433,250

    7.5

    15.16

    Source: World Bank Development Indicators

    To meet its development goals, the Indian economy must continue to advance. However, the environmental consequences of growth may be huge as it would severely deplete natural resources such as mineral, water, and fossil fuel, thereby pushing the prices of fuel, energy, and raw materials.

    The extent of green growth in India would depend on its ability to reduce dependence on the resources needed to support economic growth over time, thus improving social equity and creating jobs. Green growth can play a vital role in balancing these priorities. However, managing public debt and fiscal deficits the two main hurdles to national policy making, may obstruct the technological changes required for green growth. Additionally, trade balance would play a major role in macroeconomic policies. Therefore, it is necessary to understand and maximize the development benefits of green growth interventions across key sectors, such as energy, trade, and income.

    Government initiative towards Green Energy
    The Ministry of Finance has proposed several initiatives for the environment:

    Hydrogen Energy Mission - The initiative involves generating hydrogen from green power sources, which has the potential to transform the transport sector. It would also promote the use of clean fuels in India. The budget emphasis on green hydrogen is consistent with the technological advancement and long-term goal of diminishing reliance on batteries of minerals and rare earth elements for energy storage.

    Public Transport - For the first time, the cabinet has allocated private financing of INR 18,000 crores (USD 2.43 billion) for 20,000 buses, along with innovative financing through public-private partnerships, which would completely alter the way public transport system works in India. The initiative aims to minimize dependence on personal vehicles, and thereby reduce the carbon footprint.

    Deep Ocean Mission - The mission would undertake deep ocean survey and exploration as well as carry out projects that would protect deep sea biodiversity. A budget of over INR 4,000 crore would be allocated within five years for this program.

    Urban Swachh Bharat Mission 2.0 - The government intends to effectively manage waste from construction and demolition activities and bioremediate all inherited landfills, focusing on integrated management of manure, sludge, and sewage treatment; the classification of waste sources; the reduction of disposable plastics; and reduction of air pollution.

    Consumer preference for Greener Products
    A recent study shows the new generation is aware of sustainable products. Consumers prefer to buy products from companies that emphasize waste reduction, carbon footprint reduction, sustainable packaging, commitment to ethical labor practices, and respect for human rights. The pandemic has further increased people’s awareness of the environment.

    Consumers are now opting for recyclable plastic packaging and fibre-based packaging as they reduce environmental waste. They switch products or services when the company scores low on sustainability values, which presents market opportunities for players to innovate in favour of green products.

    Several FMCG players have committed themselves to sustainable development and have opted for sustainable packaging materials. In 2020, the world’s top 10 consumer products companies (Danone, Coca-Cola, Pepsi, Unilever, L’Oréal, etc.) set an ambitious goal of achieving 100% sustainable packaging by 2025.

    Conclusion
    As India continues to fight COVID-19, it must simultaneously charter a path to economic recovery in order to mitigate the adverse impact of climate change and promote long-term sustainable and inclusive development. The country must prioritize investment in sectors assisting the transition to a green economy and reduce social risk related to health hazards.


  26. Cryptocurrencies: An Inevitable Step Into The Future?

    Cryptocurrencies, especially bitcoin, have been making news these days. Several factors have contributed to their emergence, from the

      to read | words

    Cryptocurrencies, especially bitcoin, have been making news these days. Several factors have contributed to their emergence, from the surge in online platforms to their perception as a hedge against the dollar and their appeal to retail investors. As with any innovative change, these currencies are also fraught with challenges: their safety as an asset, the environmental hazard they pose, or the absence of government backing. However, what cannot be denied is that cryptos are changing the financial landscape. Building the right regulatory framework around them will only give these currencies more validity and make transactions more secure.

    As digitalization strengthens its hold on almost every walk of life, why should currencies be an aberration? Enter cryptocurrencies, that first made noise in the 2000s, emerging as an alternative to avoid the conventional banking sector after the financial crisis of 2008-09. Since then, these currencies have picked up significantly. The boom lately is attributable to several factors. First, cryptocurrencies are unregulated or decentralized, and anyone can participate. Also, with companies (such as Tesla, VISA among a host of others) adopting them as modes of payment and cryptocurrencies coming under the purview of taxation directly or indirectly, they are increasingly becoming mainstream. Most recently, the President of El Salvador announced that the country would soon accept bitcoin as legal tender. Moreover, the pandemic has created conditions conducive to the rise of cryptocurrencies, with investors, especially retail investors, looking for alternative sources of investment or returns, amid the surge in online platforms and touchless payment systems. Furthermore, cryptocurrencies are attracting fintech innovators at a scorching pace, and especially the younger generation. People increasingly view these as an asset, a safety net against the US dollar.

    EXHIBIT 1: MARKET CAPITALIZATION/VALUE OF CRYPTOCURRENCIES

    Source: Coindesk, As of June 14, 2021

    There are over 3000 cryptocurrencies in the market today, with total value exceeding USD2 trillion. Of these, bitcoin, which commands majority of the value share, has sparked the maximum interest, be it among investors, corporate sector, or regulators. A key reason for the rise of bitcoin, besides the host of factors mentioned above that are working conjointly, is that the currency enjoys the confidence of people. Amid limited supply (only 21 million units), demand has risen, sending its value shooting through the roof—as of June 14, 2021, the value of one bitcoin was about a whopping USD39,191, albeit substantially below the highest price (so far) of over USD63,000 reached in April 2021.

    EXHIBIT 2: BITCOIN PRICE (USD) SINCE 2013

    Source: Coindesk, Price USD 39191 as of June 14, 2021

    While the growth in bitcoin’s value has been stupendous, it has also been highly volatile. Over a span of just two months, the value crashed from over USD63,000 as recently as April 2021 to about USD39,000 by the second week of June! Such massive gyrations in price have been a staple feature of bitcoin. Since the supply of bitcoin is limited to 21 million units due to its inbuilt mechanism, the price of a bitcoin is highly sensitive to the trading of the cryptocurrency. There are three main participants in the bitcoin market: miners (who mine new bitcoins by deploying massive computing capabilities), holders of bitcoin (especially those who had bought it early at lower values) and traders (seeking to benefit from buying and selling at higher prices). As such, the value of bitcoin is highly susceptible to negative news. The latest drop in bitcoin can be attributed to China announcing a crackdown on cryptocurrency mining and Elon Musk declaring that Tesla will not accept bitcoin payment for car sales. As an alternative to pure capital appreciation-based returns, several cryptocurrencies have made ‘yield farming’ possible, i.e., earning (potentially) steady ‘interest’ on the investment in cryptocurrencies. However, these are limited to the more sophisticated crypto investors, while most retail investors still chase absolute returns and can potentially lose their principal investment due to very high volatility. This abnormally high volatility has also driven a deep wedge in the world of finance.

    Those in favor of the cryptocurrency (such as Cathy Wood of Ark Invest) argue about its utility and gradually increasing acceptance in mainstream finance. Retail investors are gravitating toward cryptocurrencies, lured by its skyrocketing valuation and the possibility of making once-in-a-lifetime gain in a very short time, which is rarely possible through mainstream assets such as fixed income or equity markets. Those who view it very skeptically are wary about its safety as an asset, non-environment-friendly aspect, and potential to be a bubble. Central bank regulators and governments view cryptocurrencies as a threat to their monopoly on issuance of fiat currency and control on money supply; plus, there is the need to trace ownership to prevent the use of the currency in illegal activities such as money laundering. For example, the recent restrictions imposed by China on cryptocurrency mining in the country are seen by many as a measure to buttress the position of its digital yuan.

    Of late, investors have begun to pay closer attention to the security issues arising from the mechanism around which these currencies operate. The key tenet of distributed ledger – the information of the transaction does not get recorded on any central ledger and hence cannot be lost – notwithstanding, the flip side is that it is neither monitored by banks nor any regulators. While the distributed ledger mechanism is strong due to the blockchain technology, it must be understood that every information or data stored digitally is vulnerable to hacking. Cryptocurrencies stored in digital lockers can be and have been hacked and stolen. MIT estimates that USD2 billion worth of cryptocurrencies have been hacked since 2017. Cryptocurrency is, therefore, no more safe or unsafe than any other information on the digital network. Electronic devices or software, by their very nature, are exposed to threats.

    The bigger grey area is the use of cryptocurrencies in illegal activities. This largely springs from the fact that cryptocurrency is not a part of mainstream banking channels or monitored/traced. Also, the ownership of these currencies is anonymous, which creates the fear of theft or loss. So, when Gerald Cotton, CEO of digital asset exchange Quadriga CX, died without sharing the password to access USD145 million worth of stored currencies, such as bitcoin and Litecoin, held on behalf of its customers, they were unable to access their digital wallets. What is at stake here, therefore, is the legality of the transaction, not the unit of transaction.

    Yet another concern is that these currencies are not allowed by major central banks since independent cryptocurrencies pose a challenge to their issued currencies. The US Fed, for instance, views even stablecoins as having the potential to destabilize payment systems. The fears to an extent came true when TITAN crypto stablecoin crashed recently. This prompted billionaire investor Mark Cuban, who lost a sizable investment in the cryptocurrency, to call for stablecoins to be brought under the purview of regulatory governance. China, on the other hand, has launched the digital version of yuan and intends to promote it over independent cryptos. The ECB as well as other major central banks worldwide are still deliberating over cryptocurrencies.

    The damage to the environment caused by cryptocurrency mining is another major issue, especially amid rising awareness about climate change globally. As cryptocurrency transactions entail intense data mining, electricity consumption is very high. It is believed that the electricity consumed in crypto mining surpasses the annual electricity consumption of many countries. While wastage of power is a concern, the counter argument is that it is not restricted to this mode of payment alone. The traditional banking infrastructure is also a massive consumer of electricity, but does this put banking under any kind of scrutiny? Also, renewable energy resources are estimated to be increasingly used to meet cryptocurrency’s energy requirements.

    EXHIBIT 3: BITCOIN MINING CONSUMES MORE ENERGY THAN SEVERAL EMERGING AND EUROPEAN COUNTRIES

    Source: Cambridge Centre for Alternative Finance; Enerdata; Country data as of 2019, Bitcoin data as of May 2021

    Many other concerns stem from these main issues, such as cryptos not having value as these are not tangible, and, hence, speculative, or not being taxable in the absence of being monitored by any central authority, or volatile with values yo-yoing massively following any trigger – maybe a tweet by Elon Musk or China’s crackdown on crypto mining. Some of these can again be rebutted – profits from bitcon are taxable in certain nations, while countries across the world are beginning to experiment with their own digital cryptocurrencies.

    Having said this, investors cannot throw caution to the winds. For one, that this is not real money, technically speaking, i.e., the currencies do not have the backing of a government or a central monetary authority. These digital modes of payment run on high-power computational technology, which like any technology will have limitations – access to networks, reliability of connections, and security too, irrespective of how robust the mechanism is. Then their stability as a mode of payment will always be questioned what with the values fluctuating widely. Furthermore, it will take time for their credibility as a mainstream investment instrument to be established. Last but not the least is the lure of legal tender – digital money may find it hard to rival this, given the security of government-backed currencies.

    This brings investors and users then to a crossroad – what to make of cryptocurrencies. The answer may emerge only with time, depending on how they are governed by the market forces of demand and supply. Whether or not bitcoin, its peers or other advanced successive cryptocurrencies turn out to be a mere speculative bubble, what cannot be denied is that they are super advancements in technology set to reshape the financial landscape. What may be needed is better monitoring or enforcement measures involving the government/central banks to give cryptocurrencies validity and stronger protocols to ensure privacy and safety of transactions. Buttress this with intensive due diligence on investor’s part to understand the instrument. While yes, there is no foolproof formula against fraud, this can go a long way in keeping any investment safe, digital or fiat.


  27. Financial Data Management – How Would AI Shape the Financial Services Industry?

    Artificial Intelligence (AI) is increasingly incorporating sophistication and intelligence in various processes in the financial industry. Through its

      to read | words

    Artificial Intelligence (AI) is increasingly incorporating sophistication and intelligence in various processes in the financial industry. Through its various tools, AI is simplifying complex financial tasks and making them less labor-intensive. Enhancements in AI would introduce more advanced methods and approaches, which would further help the industry boost productivity. Several financial firms have already adopted AI, and the technology is set to further penetrate this space.

    AI has been redefining industries and sectors across the globe. Being the early adopters of AI, the financial services industry has been benefitting from its countless applications. AI has become a favored tool of stock market traders, wealth managers, insurance companies, and bankers.

    Though AI has varied applications, it has limitations with regard to where and how it can be applied. Nevertheless, AI tools, such as machine learning (ML), natural language processing (NLP), and sophisticated algorithms that can perform complex mathematical tasks, are capable of creating financial models and running through huge data sets in a matter of minutes.

    AI Tools

    • NLP – NLP has the ability to run through vast data sets and find the relevant miniscule piece of information. Investment bankers, traders, and wealth managers use NLP software for data collection and analysis. Banks and insurance firms apply NLP to social media-related data for marketing and communication strategies.
      NLP can improve the speed and accuracy of investment research for stock traders and wealth managers. For example, NLP algorithms can browse through websites for news on M&As, corporate deals, or IPOs, and quickly share relevant information with a financial analyst. The algorithms can also perform sentiment analysis of certain stocks or companies to gain an understanding of how consumers are reacting to a financial news. With such specific data at their fingertips, financial analysts, stock traders, and wealth managers can gain insights on how the stocks would perform, and thus, take informed buy or sell decisions.
      Sentiment analysis can be used to gauge customer sentiments around a brand, based on comments and testimonials on social media platforms.
      Some financial institutions use NLP to determine an individual’s credit worthiness, business intelligence, and sentiment analysis for customer service.
    • ML – Various ML models can aid financial companies automate and further digitize their tedious documentation processes through NLP. These can be integrated into existing workflows without disrupting the current processes. The NLP software automatically reads and understands documents that involve mortgage or loan processing.
    • Predictive analytics – Wealth managers, investment bankers, and traders can use predictive analytics software to estimate stock performance. AI models can be designed to simultaneously run through thousands of stocks and corelate certain data points to predict the stock returns. The technology is also proficient in suggesting the top stocks to buy or sell at a given point of time. With the help of ML algorithms, AI models can also conduct risk analysis of stocks to make recommendations. Such technology would help managers and investment bankers in creating a portfolio for their clients on the basis of risk profiles.

    AI Applications

    Portfolio Management
    "Robo-advisor" is a new term that is becoming increasingly popular in the financial domain. Robo-advisors are algorithms built to calibrate a financial portfolio based on the goals and risk tolerance of a user. For example, if a user enters his/her financial goal as INR10,000,000 in savings at the end of 70 years of age, the robo-advisor spreads the investments across different financial instruments and suggests alternatives to achieve this goal.

    If the user changes the requirements or market scenario, the algorithm accordingly calibrates these and aims to find the best fit for the individual’s goals. Robo-advisors have gained significant momentum with Gen X and Gen Z consumers who do not want to interact with human advisors.

    Document Digitization
    A key challenge faced by insurance firms or banks or financial institutions while adopting AI is that large volumes of historical data are stored in paper documents, which need to be digitized. To achieve this, computer vision software can be used. Employees at financial institutions can scan and upload PDF documents on the computer vision software, which reads through the text using the optical character reader (OCR) technique to get the desired output in text.

    Users only need to scan and upload the paper documents. The software will run the algorithm through the PDFs and “read” the content, thereby populating fields on a digital version of the document from the PDF. This kind of digitization further prepares documents for AI-based search functionality.

    Search Key Information Through Large Database
    Financial institutions often struggle to search for key information in large data sets; this is where NLP comes to the rescue. It can be used to identify and extract the exact text needed from a huge set of digital data. NLP uses context-based algorithms that scan the entire database to obtain the desired output.

    Outlook
    The financial services industry is evolving rapidly and using technologies to enhance the efficiency and accuracy of its processes. The industry has seen wide-scale adoption of AI, which would further penetrate into the space as the technology advances. AI has given the world of banking and finance a new way to service its customers and meet their demands. It is making the entire process of banking and investing smarter, more convenient, and safer to access.


  28. Will Slowing Vaccination Rate put the Brakes on the US Economic Recovery?

    The COVID-19 pandemic sent the US economy reeling in 2020. The US economy went into recession and the country

      to read | words

    The COVID-19 pandemic sent the US economy reeling in 2020. The US economy went into recession and the country had to face staggering unemployment. A rapid vaccination drive and multiple fiscal stimuli of over USD5 trillion is expected to help the country recover. However, the rate of vaccination in the US has slowed down, even as several US states rolled back restrictions put in place to contain the spread of the pandemic. Even post vaccination, the full resumption of economic activity may not be immediate. Several headwinds will likely line up, including inflation, rising Treasury yields, and red-hot markets. The slowdown in vaccination rate could put another hurdle in the US economic recovery, especially if cases surge and restrictions need to be reimposed.

    The pandemic, which hit the world in 2020, led to a humanitarian as well as economic crisis. Countries worldwide went into recession due to forced lockdowns and sealed borders. As businesses suffered, even developed economies, such as the US, were dealt a severe blow. The damage to the corporate sector had a domino effect, as unemployment rose and further pushed the economy downhill.

    In response, countries across the world joined the race to develop viable vaccines to combat the pandemic. In 2021, three vaccines were developed and approved in the US. The country initially undertook a rapid vaccination drive, and citizens are currently being vaccinated in high numbers. The government is hopeful that the vaccination would help revive regular life and the economy would bounce back.

    Vaccination was initiated in the US in December 2020. By April 2021, almost 245 million doses were administered, fully vaccinating 31.6%, i.e., over 104 million people of the US population. This put US among the top nations around the world in terms of percentage of population vaccinated.

    Figure-1 US among top countries in terms of percentage of population vaccinated

    Source: Our World in Data

    However, the vaccination rate is now dropping, owing to hesitation among sections of the population to get vaccinated. While almost 3 million people were being vaccinated on a daily basis till April 2021, the number is currently as low as 2 million and falling. This would prolong the government’s target to vaccinate the entire population soon.

    Figure 2 – US Daily Vaccinations

    Source: Our World in Data

    The initial vaccination drive acted as an indirect stimulus for the economy by encouraging local governments to lift restrictions on movement; this has been complemented by President Biden’s USD1.9 trillion American Rescue Plan. The stimulus package is being spent on vaccine distribution and virus testing, as well as enhancing medical facilities. Moreover, the package would help small businesses get back on their feet and recover from the pandemic. This is the sixth federal rescue package announced since the outbreak, and more may be on their way.

    The stimulus spending is making its way to those who need assistance. Furthermore, households with excess personal savings and pent-up demand from the pandemic are ready to spend, while B2B spending is also on the rise. This is evident from the sharp uptick in consumer spending, which could lead to a major hiring boom.

    The US Federal Reserve increased its estimate of US GDP growth to 6.5% in March 2021 from 4.2% in December 2020. This sharp growth (exceeding even that of China) has the potential to spill over to the trading partners of the US, including Mexico, China, and Canada, though the rebound will differ from country to country.

    US Economic Recovery

    Source: US Labour Bureau, US Federal Reserve, Institute of Supply Management (ISM), US Census Bureau

    Though the outlook appears positive, some hurdles need to be crossed before the economy can make a complete recovery. While equity markets are stable and doing well, challenges exist in other areas:

    • Inflation is expected to rise in 2021 due to a combination of factors (rising commodity prices, ultra-loose monetary policy, direct stimulus checks in hands of citizens, low base effect)
    • Treasury yields are rising due to expected inflation.
    • Asset prices are already high. The waning pandemic has led to the surge in equity, bond (especially high-yield segments), commodities, and housing markets. As valuations increase at a rapid pace, these markets would peak and crash, negatively impacting the economy.

    With the vaccine drive ongoing and recovery from the pandemic in sight, the outlook for the US economy is positive for now. However, the slowdown in vaccination rate could put a spanner in the works, and the US economy may not recover quickly as expected. Moreover, the country needs to be ready to handle runaway inflation and ballooning asset prices by passing relevant policies as soon as possible. If not prepared, the rising economy could face obstacles and decline.


  29. Can blockchain help overcome election voting woes in India?

    The voting system in India faces many challenges and has come under heavy scrutiny time and again. These

      to read | words

    The voting system in India faces many challenges and has come under heavy scrutiny time and again. These issues could be eliminated with the implementation of a blockchain-enabled voting process that would be carried out online. The current voting process requires the voter’s physical presence, which has led to a decline in their numbers, but this online process could be the solution. Voters will be able to cast their votes from another city as well and hence exercise their democratic right. This initiative is still under development and only time will tell if it will be a success.

    One of the new-age technologies that is making waves is blockchain. It has already entered the financial sector and is making inroads in other industries as well. The advantage of blockchain technology is that it records information in a way that makes it difficult to hack, cheat, or tamper with the data submitted. It is a digital book of transactions that is replicated and distributed throughout the network of systems on the chain. Each block in a blockchain contains numerous transactions, and every new transaction is added as a separate entry to each journal.

    Due to encryption and decentralization of the technology, blockchain transactions are not corruptible, and every transaction is easily certifiable. To corrupt a blockchain, every block in the chain would have to be altered across the distributed systems of the chain, which is not impossible but quite tedious and time-consuming.

    Blockchain and the Indian voting process
    In recent years, there have been several reports of elections being tampered with across the world. The integrity of the election process is an increasing global concern, especially following the misinformation regarding the 2020 US presidential elections.

    India’s current voting system is still fairly traditional and follows the age-old processes. Voters need to assemble at a center allotted by the local authority to cast their votes. The process followed to collect and then count the votes has many irregularities that allow cheating and errors.

    Blockchain’s transparent, encrypted, and decentralized system could provide an alternative by facilitating an online voting system that would minimize fraud or tampering. As blockchain transactions are difficult to erase or edit and due to the absence of a central system, it would be a secure way to conduct the voting process.

    Apart from the actual process, the counting of votes is a time-consuming activity. If any of the parties challenge the results, the recounting of votes, as seen in the 2020 US elections, becomes cumbersome and consumes significant resource. This issue could also be eliminated through blockchain as it would provide real-time data and ensure error-free results.

    Indian elections:
    One of the main issues India is facing at present is the declining voter turnout. The government attributes this to the fact that people have to vote from the constituencies where they have registered. Throughout the country, an estimated 450 million people have migrated from their hometowns for work, education, and so on, and many of them do not register in their new constituencies. As a result, about one-third of the 900 million people eligible to vote in the 2019 general elections did not cast their votes.

    The decreasing voter turnout, coupled with growing concern over voter registration integrity, poll accessibility, and election security, has prompted the government to contemplate blockchain-based voting platforms. The Election Commission (EC) of India, in collaboration with the Indian Institute of Technology (IIT), is seeking to develop a blockchain-based voting system that will allow voters to cast votes without going to the assigned polling center of their respective constituencies. The project, though in the R&D stage, would benefit seasonal and migrant workers, who account for approximately 51 million of the population (as per 2011 census). Moreover, such a voting system could benefit remotely stationed members of the armed forces.

    The system would allow registered voters to cast votes from any part of the country, regardless of their constituencies; however, voters would still be required to visit an assigned center to avail of this facility.

    Trials across the globe:
    This is not a new concept as several blockchain-based elections have already been conducted across the globe. Many companies are already working to develop blockchain-based voting systems.

    The first large-scale political elections using blockchain technology were held in Thailand in November 2018, where the Thai Democrat Party held a primary election via ZCoin. The Republic Party of Arizona piloted a blockchain-based voting system, Voatz, where officials used the mobile application-based solution during the pandemic. Similarly, after its initial pilot project, Russia is planning to expand blockchain voting across the country in its next parliamentary elections.

    Concerns:
    As with any new disruptive technology, there are a few challenges associated with blockchain-based voting systems as well. For instance, in the voting system being developed by the Indian government, voters would still have to reach a designated venue to cast their vote, be it in a different city.

    The functioning of these systems depends on the proper execution of cryptographic protocols. In case of any error/inadequacy in execution, it could potentially reveal the identity and voting preferences of the voter or allow an individual to cast a vote as someone else.

    Conclusion:
    Blockchain is an emerging technology and has its set of disadvantages. The process of voting from home, a “anytime-anywhere-any device,” would still require more time and technological advancement. However, the application of a blockchain-based voting system would help overcome the shortfall of India’s biggest electoral challenges, i.e., voting center accessibility.

    While the guidelines of election may have to be reformed to make way for such a transparent system, the implementation of a blockchain-based voting system is a great value proposition.


  30. Understanding Impact Investment

    Impact investing has seen a significant rise over the past decade and the trend is likely to continue.

      to read | words

    Impact investing has seen a significant rise over the past decade and the trend is likely to continue. As awareness of environmental degradation and the need for social developments increase, investors are favoring enterprises that have clearly defined social impact objectives. Despite the belief that COVID-19 might discourage investment in this space, the reality is somewhat different. Though impact investment is not a new term, it has gained more relevance in the post-pandemic world.

    The rising awareness of climate change is compelling businesses to be sustainable and environment-friendly. The devastation caused by the global pandemic has also led to businesses becoming more socially responsible; as a result, impact investing is becoming more prominent.

    Introduction to Impact Investment
    The term "impact investing" was coined in 2008 by the Rockefeller Foundation to define how companies could use their capital differently. This concept suggests that a company should strive to generate positive social or environmental effects, in addition to financial gains, through its capital investments.

    Many investors are now keen on investing in stocks or funds that are both profitable and reflective of their social values. More often, investors and corporates use terms such as socially responsible investing (SRI), environmental, social and governance investing (ESG), and impact investing interchangeably; however, these terms have inherently different meaning.

    SRI involves selecting or eliminating investments based on specific ethical guidelines. ESG looks at a company's environmental, social, and governance practices, alongside more traditional financial measures. Impact investing, on the other hand, focuses on helping a business or organization complete a sustainable or social project or develop a program that benefits the society or environment. Impact investments are usually carried out through closed-end PE and VC funds. Debt funds have also gained popularity in recent times among impact investors.

    According to GIIN estimates, over 1,720 organizations managed USD 715 billion in impact investing AUM as of the end of 2019. Big players such as TPG, KKR, and Bain Capital have already launched impact funds, while Goldman Sachs, US Bank, and UBS have added an impact investment platform to their asset management practices.

    A negative perception surrounding impact investment is that it generates lower returns compared to market rates; however, this is not true. Largely, the range of returns in impact investment funds mirrors those in conventional funds. Generally, in traditional markets, fund performance varies across firms, implying that a fund manager’s investment selection is vital to achieve high returns. Across various asset classes and strategies, top investment funds pursuing market-rate returns perform at levels at par with their peers in traditional markets. In several instances, the average performance is also relatively similar.

    In impact investing, apart from the investment’s ability to generate favorable returns, identifying a timely exit option is a key evaluating factor that affects an investor’s decision. The traditional exit-oriented approach favors high-risk, high-growth enterprises that can compromise either the social enterprise’s mission or its natural growth trajectory. Most private equity investors express a desire to identify “responsible exits” aligned to the enterprise’s social mission and are therefore favored.

    During pre-investment due diligence, investors seek companies or projects that have impactful business models and whose founders have a strong commitment to making a difference. Companies with business models that focus on creating impact face few trade-offs between impact and financial objectives and are unlikely to depart from their mission. Hence, investors can exit at the right time without creating a deviation of the business model or impact washing on arrival of a new investor.

    What lies ahead...
    The COVID-19 pandemic is perhaps the most defining global event of this century. Its wide-reaching health and economic implications were expected to majorly alter an investor’s investment plans; instead, it has validated the plans and vision of impact funds. Most investors in a survey conducted by GIIN indicated that they are unlikely to change the amount of capital they had planned to commit to impact investments in 2020 due to the pandemic (57%). However, 20% are somewhat likely to commit less capital than they had originally planned, while 15% are likely to commit more.

    A number of investors preferred injecting more fund into their current projects, especially in investments that are providing solutions to counter the effects of the pandemic. Impact investment surged in sectors such as telemedicine enterprises and online learning as well as for issuers and businesses offering solutions that prevent, test, and treat the affected patients or support recovery from the pandemic-induced economic crisis.

    Given the increasing awareness of climate change, sustainable development, and responsibility to society, investors are looking to fund projects and companies that bring such a positive change. Impact investing is expected to witness exponential growth over the next decade and beyond. The philanthropic approach of giving to charities is no longer the only way to make a difference; impact investing is now considered a key driver of positive change.


  31. Has the Pain Subsided for the Microfinance Industry in India?

    The COVID-19 pandemic has taken a toll on the microfinance industry in India, with daily-wage workers facing the

      to read | words

    The COVID-19 pandemic has taken a toll on the microfinance industry in India, with daily-wage workers facing the maximum brunt of the pandemic. Accordingly, the collection efficiency of microfinance lenders plunged during April–May 2020. The pandemic poses a financial risk to MFIs, as credit costs are expected to rise. Two good practices are expected to emerge out of this crisis: improved risk management and digitization for improving operational efficiency.

    Microfinance recognizes that poor people are remarkable reservoirs of energy and knowledge, posing an untapped opportunity to create markets, bring people in from the margins and give them the tools with which to help themselves.

    – Kofi Annan

    Introduction to microfinance

    Microfinance institutions (MFIs) are non-banking financial companies (NBFCs) registered with the Reserve Bank of India (RBI). These NBFCs offer short-term loans to people at lower interest rates compared with primary lenders. They usually focus on serving people from rural and semi-urban areas who need money urgently for a short time period, usually one to two years.

    History of microfinance in India
    The microfinance sector emerged from the need to provide easy access to savings and credit facilities to small businesses and entrepreneurs who lack access to banking and related services. Loans to the less affluent sections of the society are often faced by restraints such as lack of security and high operating cost. Microfinance was thus developed as an alternative for providing loans to people having low income, with the goal of realizing financial inclusion and equality. Nobel laureate Muhammad Yunus introduced the concept of microfinance in Bangladesh by launching the "Grameen 80 Bank". NABARD took this idea and launched microfinance schemes in India. With the emergence of informal self-help organizations, microfinance in India began in the 1970s and reported strong growth figures after 1991, owing to the liberalization of the economy and increased lending by private sector entities.


    Indian MFI market
    In the past decade, microfinance has been growing simultaneously with the Indian economy. The sector has played a key role in providing formal loans to underserved low-income households and micro-, small-, and medium-sized enterprises (MSMEs), thus increasing their contribution to India's overall GDP.

    The pie-chart below shows the market share of each peer group in the microfinance industry. Compared with Q2 FY20, the market share of NBFC-MFIs declined by 1%, while that of banks increased by 1%, SFBs increased by 2%, and NBFCs declined by 2% in Q2 FY21. Banks have the highest market share as at the end of September 2020 at 41%, followed by NBFC-MFIs at 30%.

    Micro-credit Loan Outstanding across Lenders as of September 30, 2020

    Source: MFIN Micrometer, September 2020

    At an industry level, as of September 2020, GLP increased to INR2,31,778 crore, from INR2,01,724 crore, up 15% compared with 2QFY20. A total of 10.5 crore clients had outstanding loans, while the number of unique borrowers stood at 5.71 crore. With respect to NBFC-MFIs, the aggregate GLP of MFIs was INR71,147 crore as on September 30, 2020, including owned portfolio of INR57,270 crore and managed portfolio of INR13,878 crore.

    Outreach Trend

    Source: MFIN Micrometer, September 2020

    Loan disbursement is dependent on funds received by the MFIs from lenders, primarily commercial banks. For NBFC-MFIs, in 2QFY21, a loan sum of INR10,617 crore was disbursed through 32.26 lakh accounts. Owing to the pandemic, this is roughly 43% lower than the 2QFY20 disbursements, but slightly higher than that in 1QFY21, indicating progress. During 2QFY21, the average loan sum disbursed per account was INR32,912, up 20% compared with that in the corresponding quarter of the previous financial year.

    Disbursement Trend

    Source: MFIN Micrometer, September 2020

    The loan portfolio is the key income-generating asset recorded in an MFI’s balance sheet. Interest income generally constitutes over 90% of an MFI’s total income. Lending, obviously, is fraught with the inherent risk of repayment default. Therefore, MFIs should maintain a healthy loan portfolio with minimum loan defaults to ensure profitability and financial health. For NBFC-MFIs, Portfolio at Risk (PAR) greater than 30 days as on September 30, 2020 was 2.51%, which weakened from 2.02% in 2QFY20, mainly because of the COVID-19 pandemic-related operational challenges.

    PAR Trend

    Source: MFIN Micrometer, September 2020

    In terms of industry-wide regional distribution of portfolio, in 2QFY21, East and North East India accounted for 40%, South India accounted for 28%, West India accounted for 14%, North India accounted for 11%, and Central India accounted for 7% of the portfolio. Client outreach data in 2QFY21 in various states shows that the outreach in terms of GLP of some major states such as West Bengal and Tamil Nadu was very high compared with their counterparts. Among the top 10 states, West Bengal had the highest average loan outstanding per unique borrower of INR54,641, followed by Assam at INR49,000. Data also suggests that the top 10 states constitute 81.96% of the total industrial GLP.

    Portfolio of Top 10 states

    Source: MFIN Micrometer, September 2020

    The list of top 10 MFIs in terms of loan portfolio as of FY20 is indicated below. Among these, SKDRDP has the largest portfolio, i.e., 11% of the total portfolio of the sector. CreditAccess Grameen, Satin Creditcare, and Spandana are the other major players in this area.

    Name of MFI

    Gross Loan Portfolio ( crore)

    Percentage

    1

    Sri Kshethra Dharmasthala Rural Development Project (SKDRDP)

    11,629

    11%

    2

    CreditAccess Grameen Ltd.

    9,896

    10%

    3

    Satin Creditcare Network Ltd.

    7,220

    7%

    4

    Spandana Sphoorty Financial Ltd.

    6,829

    7%

    5

    Asirvad Microfinance Ltd.

    5,503

    5%

    6

    Muthoot Microfin Ltd.

    4,932

    5%

    7

    Arohan Financial Services Ltd.

    4,854

    5%

    8

    Annapurna Finance Pvt. Ltd

    4,030

    4%

    9

    Fusion Microfinance Pvt. Ltd.

    3,608

    4%

    10

    Samasta Microfinance Ltd.

    3,400

    3%

    Source: Bharat Microfinance Report 2020

    Impact of COVID-19 pandemic on microfinance sector in India

    The basic characteristic of an NBFC-MFI’s loan portfolio is that loans are mainly unsecured, which made them very vulnerable to systemic risks caused by the COVID-19 pandemic. In contrast, other microfinance lenders had comparatively more diversified portfolios and access to lenders for obtaining last-resort facilities of the RBI, market financing, and low-cost deposits.

    The hit to the labor market severely affected low-skilled workers who did not have the option of working from home. Hawkers, small traders, and daily-wage laborers, who constitute the largest share of microfinance borrowers, were the worst hit by the lockdown imposed in March 2020. This category represents about 32% of the total employment, but it suffered around 75% of the financial impact of the lockdown. However, with the gradual lifting of lockdowns, the employment situation improved in the following months, with the overall unemployment rate decreasing to 8.13% in August 2020 from 26.19% in April 2020.

    Month-wise Trend in Collection Efficiency


    Taking into consideration the difficulty in repaying loans, a substantial proportion of microfinance borrowers availed loan moratorium. In the first week of April 2020, only 30% of the micro loan borrowers had availed the RBI-prescribed moratorium. However, the ratio surged to around 70% by the end of the first week of May 2020. Due to this, recently obtained data indicated a steep fall in the collection efficiency of microfinance securitization pools. The collection efficiency first fell to 83% in March 2020 and then stumbled to a record low of 3% in April 2020. Eventually, collection efficiency recovered to 21% in May 2020 and 58% in June 2020. Compared with microfinance pools, other securitization pools (e.g., housing loans (HLs), loans against property (LAPs), Non-MFI: personal loans, gold loans, and commercial vehicle loans) performed better, with the decline in collection efficiency being less pronounced.

    The COVID-19 pandemic presented liquidity risks to NBFC-MFIs. As can be seen from the maturity pattern of liabilities and assets of NBFC-MFIs as on March 31, 2020, individual as well as cumulative time periods showed positive gaps (inflows > outflows). This was due to the fact that customarily, the liabilities of NBFC-MFIs mainly comprise long-term borrowings, while assets comprise short-term loans having high repayment frequency. However, the liquidity profile was affected due to challenges in loan collections and increase in credit delinquencies during the pandemic. Furthermore, the moratorium availed by borrowers affected the inflows. Two different stress scenarios are portrayed: Scenario-1 assumes 40% drop and Scenario-2 assumes 80% drop in loan collections (constant outflows assumed in both scenarios). In Scenario-1, cumulative gaps narrowed, but remained positive across time periods. However, in Scenario-2, cumulative gaps up to 6 months and up to 1 year turned negative, indicating the need for additional funding at an aggregate level.

    Structural Liquidity Profile: NBFC-MFIs

    Source: RBI, ICRA, MFIN

    What lies ahead….

    The COVID-19 pandemic is probably the biggest tail risk event since the 2008 financial crisis. Due to disruptions in business operations and supply chain, the probability of loss of jobs and resulting drop in household incomes were high. Accordingly, due to the COVID-19 pandemic, the microfinance sector is expected to face financial risks in the near term. Credit costs for MFIs are expected to increase. ICRA stated that the credit costs for the sector would remain volatile, with an annualized mean level of 1.5–2.0%. The credit cost would differ across cycles and among players, depending on risk management practices. The sector will likely report a return on equity (RoE) of 13–15% in FY21. Furthermore, credit discipline may get affected by disruptions in MFI operations. However, the crisis may also incentivize digitization. Efforts to migrate loan collections to digital platforms may greatly improve operational efficiency and help in minimizing event-based disruptions.

    In November 2019, for NBFC-MFIs, the RBI allowed the increase in the maximum indebtedness of a borrower to INR1.25 lakh from INR1.0 lakh earlier. This change could rapidly increase the ticket sizes. While this may help MFIs in significantly lowering operating costs and improving client retention, microlenders such as banks and SFBs, which also serve the same customers, are not covered by these guidelines. Hence, the overleveraging risk would increase and would need to be mitigated through an in-depth review of the debt-servicing ability of borrowers and highly evolved risk management practices on the part of lenders.


  32. Will American Students Be Free of Mortgage in Near Future?

    Students in the US have been carrying the burden of student loan for years now. Several students are

      to read | words

    Students in the US have been carrying the burden of student loan for years now. Several students are unable to afford the expensive tuition fees. The new government under Joe Biden plans to bring about major changes which would make life simpler for students in the future and make higher education more affordable for lower income groups. This would make more residents eligible for high skill jobs and reduce the unemployment rate.

    After swearing in as the new president of the US, Joe Biden initiated measures to fulfill the promises made to voters. One among the several issues the new government would be addressing is the rising student loans.

    • Since the past few decades, student loans in the US have been increasing at an alarming rate. As per a report by CNBC, the gross student loan (availed by 42 million borrowers) has grown over 100% in the past 10 years; it reached USD 1.7 trillion in the third quarter of 2020.

      U.S. Household Debt (Trillions)

      Source: New York Federal Reserve

    • Although the amount does not even account for a seventh of the nation’s debt, it is a concern for students from low-income households. The sudden outbreak of the COVID-19 pandemic in 2020 worsened the situation as numerous students were unable to find work and start debt repayment. The abrupt spike in the unemployment rate created a bleak situation for both the students and the country.
    • The new government under President Biden is trying to make the situation better. It plans to forgive student loan debt and make college education free for some sections of the society.

    Some of the measures included by President Biden in his plan are as follows:

    Waive off a minimum of USD 10,000 of loan per student on an immediate basis

    Waive off the remaining amount after 20 years without tax burden

    Cancel monthly interest-bearing payments for students with annual family income less than USD 25,000

    Waive off an additional USD 50,000 of federal loan for those contributing through public service


    Moreover, President Biden aims to make public colleges and universities tuition-free for students from households with annual income less than USD 125,000.

    This would ease the burden on students and make higher education for those from low-income families affordable. In the long run, this would open avenues for employment for citizens and further reduce the dependence on immigrants for high skilled jobs. These steps may further increase the nation’s debt; nonetheless, President Biden is planning to offset the loss with the tax exemption given to the high-income category on incurring high business losses.

    As per higher education expert Mark Kantrowitz, “Forgiving USD 10,000 in federal student loan debt per borrower would cost USD 377 billion and would eliminate all federal student loan debt for about a third of borrowers. If loan forgiveness were limited to just borrowers who owe USD 10,000 or less, the cost would be USD 75 billion.”

    Waiving off student loan because of the high unemployment rate due to the pandemic may provide relief for some time; however, the total student loan would continue to increase if fees for undergraduate and graduate programs are significantly high. On the other hand, capping the fees for colleges and universities would bring about a lasting change. This would provide major relief to the existing student loan bearers. Moreover, it would make education affordable for locals and improve domestic hiring for businesses which would further ease the immigration costs, resulting in a better economy.

    The Levy Economics Institute of Bard College had published a study in February 2018. As per the study, cancellation of the total outstanding student debt of about USD 1.4 trillion by the government would boost the nation’s GDP by up to USD 108 billion a year on average for the next 10 years.

    President Biden has extended the moratorium period for repayment of federal student loans for the next eight months, at least. According to the Federal Reserve, the monthly payment toward student loan ranges between USD 200 and USD 299. Hence, extending the moratorium for eight months would reduce the burden on households to manage their credit in a better way without impacting their credit score.

    Many experts opine that this is a good start toward making higher education tuition-free; this would provide permanent relief from the heavy burden of student debt.


  33. US Oil ETFs – A good investment opportunity or a high-risk bet?

    The recent volatility in crude oil prices has attracted investor interest towards oil ETFs as a proxy to

      to read | words

    The recent volatility in crude oil prices has attracted investor interest towards oil ETFs as a proxy to play on the rebound in oil prices. As countries started authorizing emergency approvals, oil prices have shown strong resilience in recovering from the historic lows seen in April 2020. Meanwhile, oil ETFs are still struggling to recover, despite tracking the performance of benchmark oil futures. Does this mean investors betting on ETFs to gain from the anticipation of an oil-price recovery are walking into a trap? Or does the scenario point to something else entirely?

    Between January 2020 and April 2020, West Texas Intermediate (WTI) oil spot prices fell drastically from USD61 per barrel to negative USD19 per barrel due to sluggish oil demand caused by COVID-19-led lockdown restrictions and the price war between Saudi Arabia and Russia that resulted in an oversupply situation. However, the easing of lockdown restrictions and a flurry of emergency COVID-19 vaccine approvals indicated an earlier recovery in global oil demand. Thus, WTI oil spot prices recovered to the early March 2020 levels of USD48 per barrel, taking the decline rate in 2020 to 20%. However, some oil exchange-traded funds (ETFs) are still struggling to reflect this recovery in their performance (as can be seen from the following table).

    US Oil ETF YTD Returns (%)

    Ticker

    ETF Name

    AUM (USDmn)

    2020 Return (%)

    Expense Ratio

    Last NAV per Share (USD)

    USO

    United States Oil Fund

    3,685

    -67.81%

    0.72%

    33.96

    DBO

    Invesco DB Oil Fund

    446

    -20.98%

    0.78%

    8.7

    BNO

    United States Brent Oil Fund

    362

    -38.52%

    0.90%

    13.36

    USL

    United States 12 Month Oil Fund

    201

    -25.28%

    0.79%

    17.66

    OILK

    ProShares K-1 Free Crude Oil Strategy ETF

    64

    -61.06%

    0.65%

    44.3

    OIL

    iPath S&P GSCI Crude Oil Total Return Index ETN

    37

    -26.99%

    0.85%

    14.53

    Source: Bloomberg, Note: NAV as of 5th Jan 2021

    The listed oil ETFs are structured such that their returns are linked to oil price performance, and yet their features differ. The USO seeks the daily percentage change of its shares’ net asset value (NAV), for any 30 successive valuation days, to be 10% (plus/minus) of the average daily percentage changes in the price of benchmark oil, i.e., WTI futures contracts. The DBO tracks the Deutsche Bank Index Quant (DBIQ), i.e., the Optimum Yield Crude Oil Index Excess Return, which is a rules-based index comprising futures contracts on light sweet crude oil, i.e., WTI. The OIL fund delivers returns through an unleveraged investment in WTI crude oil futures contracts, while the BNO tracks the daily price movements of Brent crude oil. The USL is designed to track the price movements of WTI oil. The OILK seeks to provide total returns through actively managed exposure to the WTI crude oil futures markets. It is not intended to track the performance of WTI crude spot prices.

    Despite their investments being exposed to benchmark oil futures, these ETFs have underperformed significantly. The United States Oil Fund LP (USO), one of the largest oil ETFs, shows the highest decline of 68% among the mentioned ETFs, when compared to a decline of 21% in WTI oil spot prices as of 2020-year end. This highlights significant tracking deviation when compared with the returns seen over the past few years. Here we delve deeper to understand the reasons for this deviation using the largest oil ETF – the USO.

    USO vs WTI (CL1) Annual Return Performance

    Source: Thomson Reuters Eikon

    What is the USO ETF?
    Managed by United States Commodity Funds LLC, the United States Oil Fund LP (USO) ETF is the largest long-only crude oil ETF in the US; it has about USD 4.0bn worth of assets under management (AUM). As stated in the fund prospectus, the investment objective of USO is “for the daily changes in percentage terms of its shares’ per share net asset value (“NAV”) to reflect the daily changes in percentage terms of the spot price of light, sweet crude oil delivered to Cushing, Oklahoma, as measured by the daily changes in the price of a specified short-term futures contract on light, sweet crude oil called the “Benchmark Oil Futures Contract,” plus interest earned on USO’s collateral holdings, less USO’s expenses”. USO seeks to achieve its investment objective so that the delta between the average daily returns for USO and its benchmark oil (WTI) futures contracts should be within plus/minus 10% over a period of successive 30 valuation days. USO’s net assets consist of investments in oil futures contracts and other oil-related investments that help it gain more liquidity.

    How do Contango and Backwardation impact USO ETF’s returns vs. its benchmark oil futures?
    Usually, the USO tracks WTI short-term futures well; however, under certain market conditions, the deviations can be more vivid due to the fund’s operating structure. Unlike other ETFs or mutual funds that simply hold stocks or bonds, the USO invests in WTI oil futures contracts. Under these contracts, the USO is obligated to either take physical delivery of the millions of barrels of oili (a single futures contract represents 1,000 barrels of crude) or offset the trade before the expiry date. To avoid this, the USO holds the contracts until two weeks before their expiration previous to selling the old contract and buying another short-term contract. However, rolling over contracts this way when the market is in contango (when the spot price is less than the futures price) effectively means the fund is consistently buying at high prices and selling at low prices, thus losing money on its trades. For example, the USO will be rolling over its position by selling the WTI March 2020 contract brought at 50.3 levels on February 7, 2020 and replacing it with the WTI May 2020 contract brought at 50.8 levels, thus making a loss of USD 0.5 per unit bought. Consequently, even when oil price is rallying well, the USO NAV is underperforming against the spot oil market.

    Historically, the crude oil futures market has experienced periods of backwardation and contango, with the latter being more prevalent than backwardation.

    Near Month WTI Prices (CL1) minus 1-year forward WTI Prices (CL13)

    Source: Bloomberg

    Should investors be more cautious after the recent changes in the fund’s investment strategy?
    Since the start of 2020, oil markets were already trading in contango due to uncertainty arising from the disputes among oil-producing nations about controlling production. The situation worsened drastically as crude oil prices collapsed due to demand shock attributed to COVID-19 and reduced global petroleum consumption. Lockdown restrictions led to massive drops in industrial, travel, and manufacturing activity, which caused crude oil demand to drop by an estimated 20 million barrels per day; this created an oversupply situation, which pushed oil prices into super contango. This is quite evident from the price differential between spot prices and the 1-year forward prices increasing beyond 15 units as against the less than 5 units level seen over the past 5 years. Such an unprecedented move forced the USO to change its investment strategy by shifting from short-term contracts to long-term ones. As seen from the following table, the USO shifted its concentrated target portfolio composition in short-term futures (contracts set to expire in June 2020) during April 2020 to a more diversified composition spread over later expiry future contracts up to June 2021; the same pattern is followed in the current December 2020 portfolio mix.

    USO’S Target Share of Portfolio Invested in WTI Futures

    Expiry month

    Jun-20

    Jul-20

    Aug-20

    Sep-20

    Oct-20

    Dec-20

    Jun-21

    16-Apr-20

    80%

    20%

    21-Apr-20

    40%

    55%

    5%

    22-Apr-20

    20%

    50%

    20%

    10%

    24-Apr-20

    20%

    40%

    20%

    20%

    27-Apr-20

    30%

    15%

    15%

    15%

    15%

    15%

    Expiry month

    Mar-21

    Apr-21

    May-21

    Jun-21

    Jul-21

    Aug-21

    Dec-21

    5-Jan-21

    20%

    20%

    15%

    15%

    10%

    5%

    15%

    Source: USO’s Form 8-K Disclosures

    As lockdown restrictions ease, economic activity has improved gradually. Coupled with growing hopes of fast-track vaccine approvals, this has helped short-term oil prices bounce back to USD49 per barrel levels seen by end of 2020. However, USO NAV recovered at a comparatively slower rate to USD33 per share, mainly due to its changed investment strategy. Typically, prices in longer term oil contracts are less volatile than those in shorter term ones; hence, even the sharp rally in global prices resulted in a comparatively small move in USO’s NAV. Furthermore, the rollover cost of diversification into long-term contracts negatively affected the fund’s performance. Therefore, USO NAV recovered by only 73% since the changes were announced as against a 158% surge in WTI oil spot prices.

    US (LHS) vs WTI CL1 (RHS)

    Source: Thomson Reuters Eikon

    What should investors learn from the past?
    The current scenario is easily comparable to the global financial crisis (GFC) that started in the fourth quarter of 2008. Unusually high inventories of crude oil due to sluggish US and global demand, and issues related to the storage and physical transportation of crude oil at Cushing, Oklahoma have created an oversupply situation. As a result, the global crude oil market went into contango and remained there for a good while. As transportation issues were resolved and global demand recovered, the inventory build-up moderated and thus reduced levels of contango by April 2011. Consequently, oil prices recovered completely to the pre-crisis levels, but the USO’s NAV remained lower by 48% over the same period. There is a possibility of a similar impact of contango on the USO’s NAV now, making it riskier to play on the rebound in oil prices as economic activity returns to pre-COVID-19 levels.

    USO (RHS) vs WTI CL1 (LHS) Performance Post GFC

    Source: Bloomberg

    Conclusion
    As in the past when the crude oil futures market was in contango, the USO’s returns would tend to be on the lower side as the portfolio was invested completely in near-month crude oil futures contracts. Conversely, the USO’s current investment strategy to diversify the portfolio containing 12 months of crude oil futures may generate higher returns, provided the oil markets remain in contango. However, the easing of lockdown restrictions and faster vaccine approvals are raising hopes of a much quicker economic recovery than anticipated. Thus, oil markets might turn into backwardation, which would negatively affect the USO’s NAV due to the recent change in its investment strategy. Hence, investors should tread cautiously. What holds true for the USO would also ring true for most of the other oil ETFs, warranting caution from investors seeking to take advantage of the current oil price recovery.


  34. Are Global Equity Markets Riding on Select Stocks' Coat-tails?

    Global equity markets have defied the overall negative economic trends over the past six months and have continued

      to read | words

    Global equity markets have defied the overall negative economic trends over the past six months and have continued to rise. However, a closer look reveals that this recovery is mainly due to an increase in stocks of select companies in just few sectors, led by IT, and not broad based. Several industries are badly hit, and their stocks would continue to exert downward pressure on indices till the onset of economic recovery. As economies recover unevenly from the COVID-19 crisis, the ongoing US House antitrust hearing on tech stocks and any possible action against tech companies may create short-term pressure on these stocks, and consequently, broader indices.

    The past six months have witnessed a rebound of equity markets across the world, post a steep sell-off caused by the COVID-19 pandemic in March 2020. Several major equity indicators have either turned positive on a year-to-date (YTD) basis or are edging closer, recovering from their respective troughs on March 18, 2020. For instance, the S&P 500 index has wiped out all losses resulting from the sell-off triggered by the pandemic and reached an all-time high on September 9, 2020. Stock markets across the globe are defying negative trends, including the current economic crisis, elevated unemployment levels, and precarious economic recovery, and continue to rise. The primary reason for such resilience can be the ubiquitous massive fiscal and monetary stimulus and the significantly low interest rates.

    Even though indices have returned to their pre-COVID levels, the performance is driven by dramatic gains in stocks of only select sectors. For instance, the S&P 500 index has been propelled by sectors such as information technology (IT) and consumer discretionary. The surge in stocks of these sectors considerably impacted the overall market performance and propelled the index to new record highs. Consequently, any correction in stocks of such companies might drag the overall index down significantly, as other sectors have shown persistent weakness during this period.

    Figure 1: Equity markets sector wise performance (YTD 2020)

    Indices/Sectors Performance

    Development Markets

    Emerging Markets

    MSCI World

    S&P 500

    STOXX 600

    FTSE 350

    TOPIX

    KOSPI 200

    MSCI EM

    SSE Composite

    SENSEX

    HANG SENG

    Refinitiv GCC

    3.8%

    7.6%

    -10.9%

    -19.7%

    -4.3%

    8.1%

    0.7%

    7.3%

    -1.8%

    -14.4%

    -4.1%

    Health Care

    7.4%

    6.3%

    -0.6%

    -22.5%

    -1.3%

    43.6%

    33.6%

    48.4%

    51.2%

    31.2%

    33.2%

    Information Technology

    30.9%

    31.2%

    11%

    -7.6%

    5.8%

    15.6%

    23.5%

    24%

    42.2%

    59.1%

    15.1%

    Consumer Staples

    1.8%

    4.5%

    -11.4%

    -21%

    -6.6%

    -2.6%

    -4.2%

    54.6%

    -2.8%

    11.8%

    6.5%

    Consumer Discretionary

    22.5%

    27.8%

    -13.6%

    -50.8%

    -21.9%

    3.3%

    31.6%

    29.9%

    -0.7%

    10.1%

    50.2%

    Financials

    -19.5%

    -18%

    -7%

    -13.4%

    -22.7%

    -21.2%

    -26.3%

    -7.4%

    -22.1%

    -20.6%

    -10.5%

    Industrials

    -0.7%

    -0.8%

    -4.7%

    -7.8%

    -8%

    -11.1%

    -11.8%

    11.9%

    -10.7%

    2.6%

    -0.1%

    Utilities

    -0.8%

    -1.8%

    1%

    -6.7%

    -13.6%

    -22.9%

    -23.2%

    -2.8%

    -20%

    -20.6%

    -2.2%

    Materials

    5.4%

    8.3%

    -10.1%

    -3.2%

    -47.2%

    -13.2%

    -1.2%

    3.8%

    1.9%

    -3.1%

    2.1%

    Energy

    -46%

    -48.8%

    -39.4%

    -54.5%

    -23.3%

    27.6%

    -27.5%

    -16.3%

    23.3%

    -36.1%

    -8.1%

    Real Estate

    -11%

    -4.7%

    -18.6%

    -24.1%

    -21.6%

    -18.3%

    -23.1%

    -6.6%

    -25.5%

    -21.6%

    -5.8%

    Communication Services

    7.7%

    9.3%

    -18.5%

    -23.9%

    13.8%

    44.5%

    16.9%

    1.9%

    -6.2%

    -21.8%

    0.9%

    Source: Refinitiv; YTD – as of October 09, 2020

    In case of S&P 500, of the eleven sector indices, the IT sector index has been the clear winner with 31.2% gains YTD, followed by the consumer discretionary (+27.8%), communication services (+9.3%), and materials (+8.3%) indices. Meanwhile, the laggards have been energy (-48.8%), financials (-18.0%), and real estate (-4.7%) indices. Contradictorily, the consumer discretionary sector has defied the historic trend of being more sensitive toward recession (consumers tend to postpone their discretionary spending during recession) and became a leading sector.

    The S&P 500 index is up 7.6% YTD (as of October 09, 2020), attributed to a splendid performance by a few giant tech companies, such as Apple, Amazon, and Microsoft. The S&P 500 index, which is weighted by the market value of its constituent companies, recovered mainly due to the rally in the share prices of these mega stocks. The trend of only certain sectors boosting overall indices is observed across both developed and emerging countries.

    Conversely, the recovery in sectors after the crash on March 18, 2020 has remained uneven, as the consumer discretionary sector has outperformed the IT sector in certain indices. For instance, post March 18, 2020, S&P 500’s consumer discretionary sector index returned 78.2% YTD versus 63.2% YTD rise in the IT sector. Similar asymmetric outperformance can be observed across various geographies.

    Figure 2: Equity markets – Sector-wise performance (since lowest level on March 18, 2020)

    Indices/Sectors Performance

    Development Markets

    Emerging Markets

    MSCI World

    S&P 500

    STOXX 600

    FTSE 350

    TOPIX

    KOSPI 200

    MSCI EM

    SSE Composite

    SENSEX

    HANG SENG

    Refinitiv GCC

    45.5%

    45.5%

    32.4%

    21.6%

    29.6%

    47.1%

    42.5%

    19.9%

    40.3%

    8.2%

    31.2%

    Health Care

    32.6%

    29.7%

    20.6%

    29.4%

    29.7%

    74.7%

    64.1%

    49.6%

    74.9%

    48.3%

    56.8%

    Information Technology

    67.1%

    63.2%

    69.1%

    45.4%

    48%

    49.5%

    61.2%

    9.5%

    90.3%

    88.1%

    30.1%

    Consumer Staples

    21.5%

    18.8%

    18.2%

    17.9%

    14.3%

    26.3%

    28.8%

    68.1%

    22.5%

    33.3%

    48%

    Consumer Discretionary

    78%

    78.2%

    64.6%

    15.5%

    16.4%

    64.1%

    74.4%

    48%

    33%

    54.9%

    58.3%

    Financials

    32.2%

    32.6%

    47.4%

    41.1%

    14.8%

    35.8%

    10.6%

    10%

    18.8%

    -1.4%

    24.4%

    Industrials

    51.4%

    50.6%

    58.2%

    43.1%

    39.9%

    37.9%

    29.8%

    25.8%

    28.1%

    40.2%

    41.1%

    Utilities

    20.2%

    16.4%

    21.8%

    -2.2%

    31.1%

    26.5%

    14.2%

    9.8%

    14.8%

    -12.8%

    24.1%

    Materials

    62.8%

    62.2%

    53.3%

    52.7%

    7.6%

    38.7%

    57.3%

    24%

    41.9%

    36.6%

    49.3%

    Energy

    32.1%

    29.9%

    28.9%

    2.2%

    11.5%

    103.1%

    40.8%

    -0.1%

    90%

    2.3%

    20.4%

    Real Estate

    26.2%

    27.1%

    28%

    17.3%

    22.6%

    44.8%

    13.6%

    6.5%

    12.9%

    2.7%

    34.2%

    Communication Services

    40%

    39.2%

    6.8%

    5%

    41.5%

    73.3%

    44.2%

    -3.9%

    11.4%

    0%

    27.6%

    Source: Refinitiv; performance as of October 09, 2020

    Leading Sectors

    Information Technology
    The US tech stocks emerged as the biggest beneficiaries, as they consolidated their businesses during the lockdown. Investor sentiments were also positive, as they perceived IT to turn up as the strongest sector in the post COVID-19 world. Furthermore, lockdown and containment measures bolstered the demand for IT services, as rising number of organizations opted for automation and developing work-from-home infrastructure. S&P 500, being a market capitalization weighted index, has been propelled by the rise in market capitalization of tech companies in the US, such as Apple and Microsoft. For instance, Apple became the first company to reach market value of USD2 trillion. The rise in the share prices of these massive tech companies has offset the stragglers in other sectors. However, performance among IT sector stocks remained significantly asymmetric, with stocks of companies such as Nvidia Corp. and PayPal surging approximately 134% and 82% YTD, respectively, while those of Xerox and Western Digital plummeting by approximately 46% and 40%, respectively. Globally, the IT sector stocks have witnessed the same trend, augmenting the rally in major global indices.

    Consumer Discretionary
    The US economy witnessed a record quarterly contraction of 32.9% in Q2 2020, due to economic slowdown and COVID-19-induced business disruption. The resultant lockdown, containment, and social distancing measures have discouraged consumers from traveling to tourist places, attending large gatherings, and visiting brick-and-mortar stores. Moreover, economic uncertainty, high unemployment levels, and declining consumer confidence have led to lower consumer spending. As a result, the consumer discretionary sector, which is proven sensitive toward recession, has been significantly impacted. However, currently, the overall sector has defied the historic trend, mainly because of boost from Amazon. S&P 500’s consumer discretionary index rose 27.8% YTD, mainly on account of a surge in share prices of Amazon (around 78% YTD), as the current scenario is well-suited for its business model due to the rise in online shopping.

    Healthcare
    The healthcare sector has found itself at the forefront of this crisis. It has witnessed acceleration in growth, as people have now become increasingly health conscious. The stock prices of companies in this sector have surged, with earnings being relatively less impacted. Healthcare will likely emerge as one of the most robust sector in the post-COVID-19 world. The anticipated future growth in healthcare expenditure has also bolstered the stock prices of companies in this sector. The surge in these stocks is common across geographies, thus contributing to the recovery in majority of the global indices.

    Communication services
    Performance of the communication services sector remained mixed across global indices. However, it rose in S&P 500, mainly because of companies such as Alphabet Inc. and Facebook. MSCI World, MSCI EM, TOPIX, KOSPI 200, and Refinitiv GCC are other indices that witnessed positive returns in shares of the communication services sector.

    Lagging Sectors

    Energy was the worst performing sector owing to the sharp decline in crude oil demand, coupled with positive supply shocks. Crude oil prices spiraled down as lockdown measures across the globe led to subdued oil demand. Moreover, the pandemic has significantly impacted the earnings and cash flows of companies in the oil & gas sector, thereby leading to a rise in the number of bankruptcies and defaults. Hence, the energy sector turned out to be a major drag on global indices.

    The utilities sector was also adversely affected by the pandemic, as lockdown and social distancing measures led to the closure of workspaces, restaurants, retail stores, etc. The demand for utility services declined significantly, leading to a drop in share prices of companies in this sector.

    The shadow of US House investigation and anti-trust hearings on tech stocks
    The ongoing US House of Representative’s enquiry into Big Tech’s business practices has concluded that the tech companies are monopolistic. Consequently, the final report is expected to recommend actions in some form, possibly ranging from fines to more regulatory oversight. Although large tech behemoths, such as Apple, Facebook, and Google, may not likely be broken up into smaller entities with separate ownership, any action with long-term impact would affect these stocks negatively, and thus exert pressure on broader indices.

    Conclusion

    While majority of the stock market indices have recovered sharply from their March 2020 trough, the rally in indices is bolstered only by the stocks of certain sectors. Most of the other sectors have not yet recovered, and narrow-minded perception of headline indices can be misleading. In case of market cap weighted indices, such as S&P 500, the weightage of select stocks have increased significantly, and these stocks further exacerbate their contribution to headline index movement. Hence, in the event of these stocks witnessing a steep correction, the index would also correct its trend, as the rest of the sectors are not in a position to offset the weakness.


  35. US Housing Market: Will Robust Demand Continue?

    While the US economy sank a record 31.7% in 2Q20, the country’s housing market has shown tremendous resilience. D

      to read | words

    While the US economy sank a record 31.7% in 2Q20, the country’s housing market has shown tremendous resilience. Demand for housing rose across segments in the sector, but bigger homes in suburban or rural areas have attracted more buyers and generated interest. Is this a short-term effect of the pandemic or a long-term trend?

    The US housing market has been quite immune to the effects of the pandemic since dropping to its lowest point in March 2020. The PHLX housing index indicates a strong V-shaped recovery led by increased demand for cleaner and safer living/housing. The main drivers are multi-decade low mortgage rates, de-urbanization, strong demographics and demand-supply imbalance.

    PHLX Housing Sector Index vs S&P 500 Index

    Source: Bloomberg

    Multi-decade low mortgage rates
    The 30-year fixed rate mortgage average in the US has declined steadily for the past four decades. However, over the last 10 years, the inclination toward saving has increased following the financial crisis in 2008-09 triggered by the sub-prime mortgage crisis. The COVID-19 pandemic forced many people, particularly the millennials whose savings have risen following the Great Recession to benefit from the sub-3% mortgage rates. According to a recent 2020 Homebuyer Insights report by Bank of America, approximately 89% buyers plan to purchase their first home, while 77% are ready with the down payment (locked in currently as savings). Lower mortgage rates amid the pandemic have made it highly affordable for home buyers to purchase a high value property or a bigger house at the same monthly mortgage payment. As per an August 2020 survey conducted by The Simple Dollar, 68% of Americans (who think 2020 is an ideal time to buy a home) cited low mortgage interest rates for buying a home or a property in 2020.

    30-Year Fixed Mortgage Rate

    Source: Bloomberg

    De-urbanization or de-densification
    Health and wellness have become the top priority amid the ongoing pandemic. However, maintaining social distancing becomes difficult when people live near to each other. Apartments in metro cities are usually densely packed with shared halls and stairways, and limited open space and parking areas. Furthermore, while approximately 84% of the population in the US lives in urban areas, the urban land area constitutes just 3% of the total land area. This is driving people to suburban or rural areas with more open spaces. The year-to-date decline in home sales in some densely populated metros reflects the trend. For example, home close sales fell 7.9%, 18.2% and 8.9% year-to-date (through July) in the Chicago, New York and San Francisco metropolitan areas, respectively. Another fact that has contributed to the rising demand for houses in suburban regions is the need to stay at home. Currently, around 40% of the US’s population is working from home. A recent survey by KPMG shows that this is expected to lead about 68% of large companies to downsize their office space. Therefore, having accommodation closer to office is no longer a necessity, implying a wider choice to go with personal preference in terms of area of residence. According to the National Association of Realtors (NAR), de-urbanization could be a permanent trend even after the much-awaited vaccine is developed. A July 2020 survey by Redfin of homebuyers before the pandemic and now shows that the number of people searching for a home in suburban and rural areas has risen by 13%.

    Pre-Pandemic vs Existing Home Demand

    Source: Redfin as cited in World Property Journal

    Demand-supply imbalance
    Lower mortgage rates and pent-up demand due to de-urbanization have boosted the overall demand for homes. With resale inventory dropping to record low levels, demand for new homes is growing. According to a report by the NAR, in August 2020, existing home sales touched a 14-year high, a record level last seen in December 2006. Existing homes sales that constitute a sizable portion of home sales in the US rose 10.5% year-on-year over this period. In fact, single-family home sales grew 9.8% and 11% year-on-year in July and August 2020, respectively. Increased demand for existing homes has sent inventory levels to multi-year lows. Home building companies have seen a surge in demand for new homes in recent months. Virtual buying is picking up, with buyers adopting either a hybrid or end-to-end virtual buying approach. Rising demand for digital tour or purchase, especially from millennials and Gen Z customers, is driving homebuilders to focus on providing seamless virtual solutions that include search, house tour, finance and purchase, eliminating the need to step out.

    US Existing Home Sales Inventory (millions)

    Source: Bloomberg

    Favorable demographics
    Demand prospects for new homes across buyer segments appear strong. Going by Google search statistics, searches for first-time home buying have increased significantly in the past few months compared to the last five years. This indicates that the surge in demand is largely due to millennials and Gen Z. According to a September 2020 survey conducted by Morning Consulting on 4,000 adults on how COVID-19 has affected home ownership, 28% millennials were found more interested in buying a home, followed by Gen Z at 20%. The demand from Gen Z was particularly from college-educated professionals with jobs that had long-term employment visibility. On the other hand, millennials who have delayed homeownership and are living in rental homes are going for purchasing a house supported by several years of savings. A strong resale market has also provided exit opportunities for second-up buyers and baby boomers who are looking to invest in bigger and more luxurious homes.

    Keyword: First-time home buyer (US)

    Source: Google Trends

    Despite the secular long-term trend favoring demand, homebuilders are exercising caution due to the weak macroeconomic environment amid the pandemic and its effect on mortgage delinquencies. The mortgage delinquency rate has spiked in the last two quarters. Latest available data pegs it at 8.22% for the quarter ended June 2020, a level last seen during the fag end of the Great Recession. Unemployment shot past 13% during the June quarter following the economic shutdown triggered by the pandemic that led to job-cuts. However, the rate has been declining gradually as sectors and businesses open up slowly across the US. It was reported at 7.9% in September 2020.

    Mortgage Delinquency Rate

    Source: Bloomberg

    Despite the weak economic environment, a few macro indicators for the housing sector are looking better compared to those during the Great Recession of 2008.

    Macro factors

    Recession (Dec 07-June 09)*

    Covid-19 (Mar 20-Sept 20)*

    Consumer sentiment

    64.2

    76.3

    Housing affordability

    94

    110

    Household debt % of GDP

    97%

    75%

    Source: Bloomberg; * - average as per the time period

    Conclusion
    With a vaccine expected in the near term, business will gradually reach normalcy in some of the high employment generating sectors like airlines, retail and hospitality. Unemployment levels will come down as economic growth improves. However, it remains to be seen how the government deals with the economic impact of the pandemic until there is sustained recovery. Nonetheless, the shift in cleaner and safer livings from multi-family to single family homes due to de-urbanization is expected to continue over the long term. Moreover, with the Federal Reserve hinting at keeping mortgage rates lower for a longer period, this secular demand trend is only going to accelerate as economic growth rebounds.


  36. US Elections – Impact of Presidential Change on Equity Markets

    With the US Elections slated to be held on November 3, 2020, curiosity about who would be the next American

      to read | words

    With the US Elections slated to be held on November 3, 2020, curiosity about who would be the next American President is growing. Amid global tensions due to the COVID-19 pandemic and other geopolitical issues, citizens are hoping for a strong leadership. For Donald Trump, the current Republican President, the challenge to retain power has increased as voters’ attention has now shifted from concerns such as social equality to managing the huge number of COVID-19 cases and stimulating the economy, which has been severely hit by the pandemic. Can a leadership change from Donald Trump to Joe Biden positively impact equity markets?

    The US Presidential Elections are critical not only for the country’s citizens but also for the financial markets and business community worldwide. Historical evidence reveals that as the election month approaches, stock markets usually witness increased volatility, depicting that the uncertainty around the change in leadership affects investor sentiments. According to polls in battleground states, prospects for Joe Biden, Trump’s challenger from the Democratic Party, have improved, particularly due to the COVID-19 crisis. This could be due to people’s perception that he might have managed the situation in a better way. However, we must bear in mind that polls are to be read with some skepticism, as they may not be a true indicator of the real situation. In the coming weeks, the debate around whether the baton will be passed on to Biden or would Trump be successful in retaining his position would remain rife.

    How US elections influence domestic equities?

    Avg S&P 500 Price Performance: Presidential Election Results (1936-2017)

    Source: Strategas Research Partners

    As per a study by Strategas Research Partners, the performance of the S&P 500 index in the three months prior to elections has been successful in predicting 87% of elections since 1928 and 100% since 1984. Whenever returns have been positive, the incumbent party has won. If the index has suffered losses in these three months, the incumbent party has lost. On a forward-looking note, S&P 500 tends to perform better in the year after elections if the incumbent party wins. The average S&P 500 return during the post-election years (1936–2017) has been around 5.8% on the victory of the incumbent and approximately 2.3% on their defeat. This simply reiterates the fact that presidential change triggers “fear of the unknown,” and markets may perceive such change in a negative light.

    In the event of a change in administration and Biden assuming office, focus would be on launching new programs for clean energy, building on the Affordable Care Act (or Obamacare), and addressing the racial wealth gap. The Biden administration will likely increase taxes as well as increase regulatory scrutiny for financial and energy stocks. On the other hand, the utilities, managed healthcare, and renewable energy sectors are expected to benefit. The impact may be neutral for communications services, consumer staples, and real estate investment trusts.

    How American politics influences Asian equities?

    Years of US Presidential Election Cycle and MSCI Asia Ex Japan Performance

    Source: Bloomberg
    *Returns are calculated for the period between 1988 and 2019.
    **Returns do not include dividends.
    ***If the election year under consideration is 2016, pre-election, post-election, and midterm years would be 2015, 2017, and 2018, respectively.

    Global investor sentiments are considerably influenced by American politics. Since the 1987 US Presidential elections, MSCI AC Asia ex Japan’s average returns during election years have been weaker than those after the election. Although the index’s performance in the post-election years has been mixed, it has gained around 26% on average. Hence, we can see that Asia is a high-beta market and faces more upheaval than the US market itself.

    A change in American leadership can uplift investor sentiments, which have been low due to Trump’s unconventional approach toward foreign relations. In contrast, Biden’s approach is believed to be subtle and coordinated. Glen S. Fukushima, a former member of Hillary Clinton’s Asia Working Group and a veteran observer of US-Asia relations, believes that Biden will maintain a collaborative relationship with US allies in Asia rather than adopt Trump’s confrontational approach. Biden’s approach will treat China strategically as a rival and competitor and not as an enemy.

    If Biden reverses previous tax cuts made by Trump, beneficiaries such as Japanese auto manufacturers may experience short-term pressure. However, Biden’s pro-climate agenda would be favorable for ecofriendly car manufacturers as well as battery and equipment providers in Asia. Overall, lesser geopolitical risks may act as catalysts for Asia’s stock markets over the long term. Additionally, since Biden is in favor of increased corporate taxes, his victory could result in a slowing US stock market. This can boost Asian markets as investors would explore alternative markets.

    Overall, investors must remain cautious of the heightened market volatility stemming from unpredictable elections in the coming weeks. If Biden succeeds in becoming the President, stocks favoring themes supported by the Democratic Party, such as clean energy and managed healthcare, will likely benefit and can be considered prospective investments. However, we must bear in mind that the performance of markets is not entirely dependent on election results; it also depends on various other economic factors prevailing at that time. One can take examples of elections years such as 2000 and 2008; while 2000 was affected by the Dot-com bubble burst, 2008 was affected by the global financial crisis. Therefore, although tracking the elections is important, investors must also focus on other variables such as market conditions, industry dynamics and company fundamentals.


  37. IP Theft – China and Beyond

    The world economy has long grappled with the effects of intellectual property (IP) theft, either aided or overlooked

      to read | words

    The world economy has long grappled with the effects of intellectual property (IP) theft, either aided or overlooked by the Chinese government. Due to rising economic costs, a strong international outcry has erupted over failure to contain surreptitious Chinese malpractices in global technology and manufacturing, resulting in an outflow of proprietary corporate and military property.

    As per the World Intellectual Property Organization, China overtook the US in 2019 for the first time as the leading source of international patent applications. Concurrently, it also announced its intention to rely less on foreign production for key industrial and technological components, aiming to boost domestic manufacturing to 75% by 2025, explained by an expected increase in the number of national manufacturing innovation centers from 11 at 2019 end to 40 by 2025.

    Dubbed the “Made in China 2025” plan, this would negate key imports such as integrated circuits, worth nearly USD320 billion, a third more than China’s crude oil imports. However, this indigenization move is heavily reliant on government subsidies and “forced technological transfers” from foreign companies.

    Even as China’s topmost court, The Supreme People’s Court, has heard in excess of 418,000 IP-related cases, the detrimental impact of IP theft is on an upward trajectory. Technology and product manufacturing theft from the US alone accounts for nearly USD225 billion in losses via spurious goods and software technology and exceed USD600 billion in lost trade secret value. By mid-2020, the US Department of Commerce had red-flagged an additional 33 Chinese companies and institutions, post the ban on global leader Huawei from procuring semiconductors for incorporating US technology. This is expected to stem theft of IP, currently accounting for a 1–3% loss to the US GDP and annual revenue losses of USD200–250 billion, along with the loss of nearly 750,000 jobs in the US.

    Major cases of IP theft in the US

    Source: Top Ten Cases of Chinese IP Theft, ProsperousAmerica.org

    This trend is also prevalent in the Europe Union (EU), with China and Hong Kong being jointly responsible for more than 80% of the seized counterfeit goods in the EU. As of June 2020, EU-domiciled luxury makers and agrichemical manufacturers reported an approximate 10% loss in sales, while counterfeited goods accounted for 6.8% of total EU imports, worth EUR121 billion. This was achieved via legal invalidation of non-Chinese patents in domestic territories and the existence of patent clusters covering umbrella IP rights in specific fields, thereby obstructing genuine patents from outside China.

    Existing IP legislation fails to stem the outflow of technology due to:

    • Slow paced legal remedies that do not keep up with the rapid product and profit cycles of companies that greatly rely on product advantage buttressed by bleeding edge technology.
    • Shortfall in the capacity of trained judges in developing countries that fail to grasp the various loopholes employed by the accused firms.
    • Slow evolution in China’s IPR, aided by state-support, for cost effective theft by employing the methods of FDI, licensing, and joint ventures as infringement pathways.
    • Limitations in trade agreements, with even bilateral trade and regional free trade agreements failing to contain leaks in IP data.

    Methods of IP theft
    While state laws serve every country in protecting against intellectual property theft, individuals and companies aligned to nefarious goals exploit policy lapses and physical and cyber security loopholes to further the core competencies of rival organizations.

    Human errors have a well-documented history when it comes to IP theft, concurrent with cases where employees unwittingly misplace sensitive data devices or communicate with unauthorized entities outside the purview of the company network watchdog. An example of this occurred in 2018 when the US Marine Corps Forces Reserve leaked personal data of thousands of personnel and civilians by sending an unencrypted email with a confidential attachment to the wrong email address.

    Source: 2019 Cost of Data Breach Report, Ponemon Institute

    Privilege Abuse stems from employees exploiting company-granted access to files and sensitive data. This is done by poached or disgruntled employees committing economic espionage, made lucrative by competitors, or defaming company goodwill. For example, an employee of a US-based global energy company with privileged user access was enticed by a foreign company to steal source code and other IP from the employer. Consequently, the company lost three quarters of its revenue, half of its workforce, and more than USD1 billion in market value.

    Hacking and malware infiltration is done by using spear phishing techniques. Hackers infiltrate company networks and steal huge volumes of IP and other confidential technological and business information. For example, during 2006–18, Advanced Persistent Threat 10 (APT 10), a hacking group from China, targeted the networks of more than 45 government agencies and technology companies in the US, pilfering proprietary sensitive technology and customer/population data.

    Threats to foreign defense
    The extent of Chinese IP theft is not restricted to civilian technology and infrastructural assets. Recent cases include the alleged design theft of exclusive assets of the US Air Force and Sukhoi-class aircraft and anti-aircraft defense systems of the Russian state corporation, Rostec. The growing list of Chinese military IP theft is inherently responsible for caution adopted by foreign companies while dealing with Chinese firms. This is due to the assumption that any Chinese firm is state funded or potentially complicit in government activities.

    With respect to American technology, China's Chengdu Aerospace Corporation’s J-20 and J-31 aircraft platforms remain the headliner cases in military IP theft, each allegedly deriving core designs from the US-domiciled Lockheed Martin’s F-22 and F-35, respectively. While the latter are products with competent stealth flight capability, the former lack similar capabilities, indigenous engine design, and proficiency in core avionics and allied software.

    Source: Mic.com, various defense article sources

    This trend has been prevalent even in the case of allies such Russia, which have raised serious concerns against the Dragon State for sponsoring nearly 500 instances of reverse engineering military technology in the past 17 years. While this issue dates back to 1990s when forerunners like the Su-27 inspired the Chinese J-11 air superiority fighter, it is concurrent with Russia accounting for nearly 70% of the China’s arms imports during 2014–18, including the recent USD3 billion sale of S-400 anti-aircraft weapon systems, also an alleged victim of design theft. Precautionary measures such as bulk sales and assurances for royalties have hardly arrested this issue, resulting in China’s share of Russian arms exports plummeting to 9% in 2012 from 60% in 2005.

    While Russia accepts the above scenario as an inexorable outcome of doing business with its most enduring and powerful ally, the US has found relative success in countering Chinese intrusion. Notable cases include the recent arrest of a Chinese researcher who took refuge in the Chinese Consulate in San Francisco after furnishing false data of her service in the PLA’s Air Force. While this incident is part of the unmasking of a cyber threat team operating across 25 US cities, it succeeds other events including the arrest of a US professor complicit in the Thousand Talents Program in July 2020 and FBI’s cyber offensive in early 2019, which aided the theft of Chinese military technology, a marked deviation from previous instances of exposures, arrests, and deportations.

    Preventive methods and future course of action
    Though IP rights are not always of paramount concern for a business, failure to respect international laws, intentionally or not, could result in expensive legal ramifications.


    Effects of the US-China trade war tariffs
    The primary demand made by the US was IP theft protection and an end to forced technology transfer to China. Systemic IP theft, costing US companies at least USD50 billion per year, was the driving reason for a 25% tariff in July 2018 per equivalent worth of US-bound Chinese exports, preceding an additional 10% tariff on USD200 billion of imports imposed from September.

    After the initial denial of IP theft allegations by China, the two countries agreed to renegotiate terms to reach a favorable conclusion in December 2018. A key memorandum was also signed in December by 38 government agencies for cooperation on IP right violations, mandating barring from government funding and procurement, restrictions in land access and financing, and also temporary prohibition on importing and exporting. It also resulted in the establishment of a new Supreme-Court-level IP tribunal, to be expanded over three years, covering issues of IP violation and unfair competition.

    Beijing is currently in the process of revising patent laws and imposing heavy penalties to those connected to the country’s social system by enabling blacklisting and restricted access to flights and loans. Another problem is joint ventures between the two countries, which also leads to forced technology transfer. The opening up of China’s hi-tech and car sectors could negate the need for joint ventures, resolving some major concerns. The US wants China to commit to curb IP theft and stop forced technology transfer in exchange for market access by requiring foreign investors to form joint ventures with domestic firms. This has now been replaced by allowing majority ownership in joint ventures in several sectors — giving greater decision-making control to the overseas entity — and allowing increased and unconditional access to the domestic market.

    While Beijing is reluctant to tighten IP enforcement and technology transfer laws for fear of hindering economic development, on an expectant note, the level of scrutiny and security cannot be implemented overnight. IP security will strengthen via regular negotiations that would also bridge differences on issues including strengthened IP rights, China’s pledge to buy American farm products, and the further opening of its economy to foreign companies.


  38. The Future of Flexible Workspaces

    The COVID-19 pandemic not only bloomed into a widespread humanitarian crisis but also crippled the global economy. To

      to read | words

    The COVID-19 pandemic not only bloomed into a widespread humanitarian crisis but also crippled the global economy. To survive, companies will need to sustain their operations over the short to medium term. If they withstand the current crisis, the flexible workspace sector could then rebound and have positive long-term prospects. A sector that came up to execute agile real-estate strategies has been now pushed to the forefront with the outbreak. Organizations are likely to look at the flexible workspace market to diversify and add resilience to their occupational portfolios. Thus, flexible workspaces could account for a greater share of workspaces than ever before.

    The Future of Flexible Workspaces
    The functionalities required of commercial working spaces have been evolving over the past few years and has prompted the emergence of flexible workspaces. Also known as “flexispaces” or “shared office spaces”, the concept is altering office dynamics. A flexible workspace provides everything that a traditional office does – from desks and chairs to phones, meeting rooms, and Internet connections – but arranged in a versatile manner. The layout and design focus on the needs of the modern workforce and can easily adapt to the demands of a user at any given time. These spaces are ready to support workers as their requirements change. Flexible workspaces are thus working their way into corporate consciousness.

    Current Scenario: Flexible Workspaces
    Flexibility is a canopy term describing a role that breaks the ‘9-to-5, 5-days-a-week’ structure. As global work culture evolved, it spurred growth in the flexible workplace industry. Although growth in 2020 would be slow due to the pandemic and the consequent work-from-home (WFH) culture, it is expected to catch up rapidly from 2021 at an annual rate of 21.3%, as per a 2020 Global Coworking Growth Study. In the US, the sector grew at an average 23% annually since 2010. In 2018 alone, it made up for about two-thirds of the country’s office market occupancy gains. The outbreak, which partially affected growth in Q1 2020, escalated into a global pandemic and massively disrupted the US office spaces market in Q2 2020. Gross leasing volumes in this market plunged by an unprecedented 53.4% in Q2 2020, after a 20.8% drop in Q1 2020; however, some rebound is expected in the next couple of quarters. The US office spaces market recorded a 14-million sq. ft occupancy loss (the steepest drop since Q2 2009) in Q2 2020, bringing the year-to-date net absorption rate to a negative 8.4 million sq. ft.

    Number of Coworking Spaces by Continent

    Source: Coworking Resources

    In terms of size, North America offers the largest spaces worldwide, with an average 9,799 sq. ft per unit, followed by Asia at 8,101 sq. ft; smaller spaces are more common in Europe and South America.

    The US leads the shared workspaces market with over 3,700 such places countrywide as of March 2020, followed by India (2,197 spaces) and the UK (1,044 spaces). In terms of yearly growth in 2020, out of the largest markets, Germany and India are the two fastest growing, followed by the US and Canada.

    Top 10 Countries by Number of Coworking Spaces

    Source: Coworking Resources

    Top Companies in US Offering Shared Workspace:

    1. Impact Hub: Amongst the world’s largest accelerators and communities for positive change, Impact Hub has more than 100 communities comprising 16,500 entrepreneurs in over 55 countries across 5 continents. Through locally rooted Impact Hubs, partners, and allied networks, the company attempts to create ecosystems to drive entrepreneurial innovation and collaboration focusing on the Global Sustainable Development Goals.
    2. WeWork: This company has 341 locations in 65 cities worldwide, with almost 50 locations present in New York itself. In Manhattan, WeWork is fast becoming the largest private office tenant. It offers a “We Membership,” which includes hot desks, dedicated desks, and private offices.
    3. Your Alley: With two workspaces in New York and one each in Washington D.C. and Cambridge, MA, this brand is smaller than Impact Hub and WeWork, but is rapidly adding spaces to its portfolio in different locations.
    4. Knotel: Knotel has key offices in New York and San Francisco, but is also expanding aggressively in London and Berlin. With 45 locations and over 1 million sq. meters of workspace, it is rapidly turning into one of WeWork’s key competitors.

    Challenges in Post-COVID-19 World
    The concept of flexible workspaces gained popularity over the past decade; however, it now faces apprehension about growth since the COVID-19 outbreak. The pandemic changed working styles across industries and has directly impacted the use of flexible office spaces. Entire workforces are operating from home, with companies forced to adapt to new work norms quickly.

    Cal Lee, Global Head of Workthere, says: “The flexible workspaces market is clearly exposed in the short term to any market impacts such as what we are witnessing with COVID-19. It is at risk from companies that are not renewing contracts as they go into survival mode and we expect these figures to rise as more members seek help, putting further pressure on providers.”

    Some issues currently challenging players offering flexible workspaces are:

    • Non-renewal of agreements
    • Subdued demand for spaces due to downsizing/layoffs as companies move into cash-preservation mode
    • Tenants seeking rent relief or waivers
    • Providers offering deferred rent payment or discounts for 1–2 months, extending license agreements, allowing members to downsize the space they use
    • Implementing stringent cleaning routines requiring significant collaboration between building owners, tenants, employees, and governments to address the challenges that lie ahead

    Like many other industries, participants in the flexible workspace industry are also struggling to keep their business afloat in the face of the pandemic as well as a looming recession. This industry also faced layoffs and had to terminate or restructure several leases.

    Future of Flexible Workspaces in US
    The short-term effects on the market are already apparent. According to the latest Workthere survey (August 2020), the occupancy rate of flexible workspaces in North America is likely to be 49% by the end of August versus the pre-pandemic level of 80%. Also, the home-office concept took root in many workforces over the past few months.

    Reality Check: Can Companies Operate with Entirely Remote Workforce?
    For most companies, dealing with a workforce entirely based out of homes seems a less-than-feasible solution. Not everyone is technologically and spatially positioned in a home environment to allow comfortable, efficient working. So, what are companies likely do now?

    With such extreme change in dynamics, companies may seek spaces where employees can meet, train, and otherwise collaborate in person. Companies have realized that, while parts of the workforce can be productive when working remotely, it is quite challenging to complete certain tasks, especially when working in a team. As per a report by Buffer, the top challenges for remote employees and organizations are collaboration and communication (20%), loneliness (20%), not being able to unplug (18%), distractions at home (12%), and others (30%). Thus, a business requires a social connect to perform effectively, efficiently in the long term, along with parameters like data security and connectivity. Flexible workspaces could increasingly serve as an alternative not only to conventional offices, but also to home working environments. This could not only maintain employee productivity but also add value to operations.

    Key trends expected in the mid to long term:

    • Industry consolidation usually does not happen in a rather “new” or decade-old industry; however, with the US staring at a recession, small players are expected to shut shop and be taken over by bigger players or even new entrants with deep pockets.
    • Companies are expected to move towards renting flexible office spaces and cut down on using traditional, rented office space. Thus, flexible office spaces have a positive growth outlook.
    • As per JLL’s report on Flex Space and Coworking 2.0, transactions in this industry would span a single floor, or even less, in the short term. This is backed by the fact that organizations are signing shorter leases and require less space as a part of their workforce is already in WFH mode.
    • Office spaces are expected to evolve from a traditional setup to a modern design that enables interactions, but minimizes contact. This is likely to result in higher square footage required per person and higher overall space. However, this need may be offset by the decline in the number of employees required to commute to office regularly.

    Overall, the flexible workspace sector is well-positioned to recover in the medium term, with good long-term prospects, if it overcomes the current pain pangs. The sector came up to execute agile real estate strategies; the current pandemic has only accelerated its acceptance worldwide. This is because many companies are likely to turn to flexible workspaces to diversify and buoy their occupational portfolios. Flexible workspaces would thus shortly account for a larger share of total global workspaces than ever before.


  39. India’s Rising Forex Reserves and Its Significance

    India, at one point of time was on the verge of bankruptcy due to twin deficit and extremely

      to read | words

    India, at one point of time was on the verge of bankruptcy due to twin deficit and extremely low forex reserves worth about three weeks of imports. But for the first time in history, on June 5, Indian forex reserves crossed the USD500 billion milestone which can cover more than a year’s import. With its rising reserves, India should also focus on increasing returns on it to reduce net costs, thus bringing in greater benefits for the country.

    In 1991, India faced a major financial crisis due to poor economic policies resulting in a twin deficit and extremely low forex reserves. The situation forced it to pledge its gold reserves to avoid the specter of bankruptcy as it had measly foreign exchange (forex) reserves of USD1.2 billion at the time, worth three weeks of imports. The country was financially mired for a while, but on June 5, 2020, India crossed a milestone of USD500 billion of forex reserves. The figure was a hundred-fold growth from that in 1991. So, we can say India has progressed much and assume is ready to face any financial upheaval.

    Forex reserves are made up of external assets, namely, reserves of gold, reserve tranche position, the IMF’s special drawing rights (SDRs), and foreign currency assets [capital flows to capital markets, external commercial borrowings, and foreign direct investment (FDI)] accumulated by India. The country’s central bank – Reserve Bank of India (RBI) – controls the forex reserves. The main purpose of these reserves is to instill confidence in the exchange rate and monetary policies. The reserves also help absorb shocks during financial crises and when access to borrowing is curtailed.

    The RBI Act of 1934 provides the legal framework for deployment of reserves in gold and foreign currency assets within the broad parameters of instruments, currencies, counterparties, and issuers. Almost 64% of the foreign currency reserve is held in securities such as treasury bills of foreign countries (mainly the US), 28% is deposited with foreign central banks, and 7.4% is held in foreign commercial banks.

    As of March 2020, India had 653 tons of gold reserves, of which 360.7 tons was in safe custody with the Bank for International Settlements and the Bank of England. The rest remains within the country. In USD terms, the share of gold in India’s forex reserves increased from approximately 6.14% at the end of September 2019 to about 6.92% during June 2020.

    The return earned on forex reserves held in commercial banks and foreign central banks is negligible. While the RBI has not disclosed the return on India’s forex investment, the figure is estimated to be 1%, or less, considering the low interest rates in the Eurozone and the US.

    Trend in Foreign Exchange Reserves


    One may wonder why forex reserves are on the rise despite the slowdown in the global economy. A key reason is the increase in investment by foreign portfolio investors (FPIs) in the Indian stock market and also FDIs. Foreign investors have taken up considerable stakes in several Indian companies over the past 2–3 months. After withdrawing INR600 billion each from equity and debt markets in March, FPIs expect a turnaround in the economy later during this financial year. This anticipation has prompted them to return to Indian markets and buy stocks worth over USD2.75 billion in the first week of June 2020. Forex inflows would be further boosted as the Reliance Industries subsidiary, Jio Platforms, drew a slew of foreign investments worth over INR1520 billion. Another notable factor is that the fall in crude oil prices brought down India’s oil import bill, thus saving precious forex. Additionally, foreign travels and overseas remittances crashed during the past few months, a situation that may continue until December 2020, which would further stanch dollar outflows. Though the rupee depreciated initially, due to outflows at the start of the pandemic, it has made a good comeback since foreign capital inflows have resumed.

    Movement of INR vs. USD


    The significance of rising forex reserves is that they bring comfort to the RBI and the Indian government in managing internal and external financial issues when economic growth is estimated to contract by 1.51% in FY20–21. More than USD500 billion is a big enough cushion for India’s import bills for over a year in the event of an economic crisis. The ratio of foreign exchange reserves to GDP is around 15%. These reserves create a positive sentiment in the markets that India can meet its foreign exchange needs and external debt obligations. It also demonstrates the backing of domestic currency by external assets while maintaining a reserve for emergencies and national disasters. Since the return on forex reserves is less than 1%, there should be greater emphasis on generating returns on forex assets rather than on liquidity, thus helping reduce India’s net costs. The money can also be deployed for infrastructure development. Thus, we can unanimously say that a rise in forex reserves is beneficial for India and with efficient usage, these reserves can bring in greater benefits.


  40. KSA Telecom Sector: Taking a Giant Leap!

    The telecom industry in KSA has taken a giant leap forward in the past few years. The industry

      to read | words

    The telecom industry in KSA has taken a giant leap forward in the past few years. The industry has shown incredible progress in terms of infrastructure development and deployment of advanced technologies. Currently, KSA is among the few countries in the world to adopt 5G services and is rapidly expanding its coverage across the Kingdom, thus presenting an attractive opportunity for key players in the sector.

    Evolution of the telecom industry in KSA

    Telephone services were introduced in KSA as early as 1934. Since then, it has had many landmark moments such as the launch of the first fiber optic network in 1984, commencement of mobile phone services in 1995, and liberalization of the telecom market in 2003, which allowed private players to enter into the sector. The evolution of the sector is ongoing and with the arrival of 5G many new avenues have opened up for the operators.

    Key players in the KSA telecom market: The main telecom operators in KSA are – Saudi Telecom Company (STC), Etihad Etisalat Company (Mobily), and Mobile Telecommunication Company Saudi Arabia (Zain KSA) – holding unified licenses. Additionally, few individual internet service providers, mobile virtual network operators (MVNOs), and fixed-line service providers are also present. STC is the leading player, with approximately 50% share by mobile subscribers, followed by Mobily and Zain KSA.

    Rapid growth in the FTTH market: Post liberalization, there was an increase in the number of service providers and support from the government and the telecom regulator to new players led to an increase in competition, development of infrastructure, and deeper penetration. As of December 2019, the number of mobile subscribers in the Kingdom stood at approximately 43.8 million, with penetration of 129%. In the past few years, KSA witnessed significant improvement in the fiber to the home (FTTH) network penetration. FTTH penetration increased to 41.8% in February 2020 from 33.7% as against 2018.

    Mobile Penetration


    FTTH Penetration


    Source: CITC

    Mobile penetration, which is already above 100%, is expected to grow further with increasing usage of smartphones having multiple SIMs. In 2018 and 2019, the number of subscribers grew faster than the population growth of the country. This upward trend came after a decline in 2017 owing to the cancellation of inactive subscriptions due to the SIM authentication program. Recently, CITC implemented an open access model in the FTTH network, which is expected to increase the use of the fiber-optic infrastructure and help in achieving KSA’s ambitious target of 3.5mn connections by the end of 2020 from more than 900,000 in February 2020. Although the Kingdom is far behind leading FTTH markets, recent developments indicate strong growth and huge potential in the near future.

    Favorable demography supports demand for telecom: KSA’s demography is supportive to increase the demand for telecom services. KSA’s tech-savvy young population (69% below the age of 40) is increasingly using smartphones and the internet. In terms of internet access, KSA stands at 93%, well above the global average of 53%.

    Early adoption of 5G technology benefits KSA: KSA is among the few countries to launch 5G services, with two of the three operators started 5G services in 2019. As of June 2020, total number of 5G towers deployed reached 7,000 across ~30 cities in the Kingdom. With a solid infrastructure in place and rising demand for 5G-supported devices and applications, KSA is among the fastest markets to adopt 5G technology.

    KSA’s 5G journey


    All the three telecom operators are currently focusing on developing a strong 5G network and exploring new technologies and applications for 5G services. They are also reaching out to global technology firms such as Huawei, Nokia, and Ericsson to access advanced technologies, which would enable them to provide a full range of services across IoT verticals.

    With a strong start in the deployment of 5G, KSA’s telecom operators are in a good position to grab potential business opportunities and expand their portfolio into unconventional services, in addition to conventional telecom services.

    Solid government support boosts global position

    CITC has played a crucial role in the development of the ICT industry in KSA. Its efforts with the support of the government has reflected in the significant progress made by KSA in the field of ICT. In October 2019, KSA advanced by 16 positions to rank 38th globally in ICT adoption as per the Global Competitiveness Index.

    CITC has also supported increasing competition and transparency in the telecom sector:

    • Allowing more private telecom companies to operate with universal licenses
    • Encouraging operators to sign open access agreements for FTTH infrastructure
    • Settling royalty dues
    • Allowing more MVNOs

    ICT sector development in line with Vision 2030: Through Vision 2030, KSA’s government plans to increase fiber optic connectivity to 64% households by 2020 from 26% households. The government also targets the expansion of coverage and capacity across the cities, improving the quality, and exceeding the household coverage in densely populated cities (90%) and other urban zones (66%). Furthermore, the development of cloud infrastructure and enabling the growth of IoT technology are on the cards in Vision 2030.

    ICT infrastructure at the core of the smart cities project: Under Vision 2030, KSA is building Neom mega-city project, which is estimated to cost USD 500 billion. ICT is integral for smart cities, as it connects different components of the infrastructure. Telecom operators can leverage their existing expertise in providing ICT services to fulfill the potential demand. Recently, STC, in collaboration with Huawei, signed an SAR 1bn contract to deliver an “advanced 5G and IoT network” to support the development of Neom mega-city.

    The KSA government’s efforts and execution of plans have been well in sync with its long-term vision so far, which has enabled the Kingdom to achieve some of its targets before the planned timeline. If the momentum continues in the future, advancements in the ICT sector would play a key role in developing a less oil-reliant economy.

    Telecom sector relatively resistant in the COVID-19 pandemic

    Precautionary measures hit certain segments: The telecom sector was impacted due to the outbreak of COVID-19. Suspension of the Umrah pilgrimage, restricting Hajj to a limited number of visitors, and suspension of international flights had a negative impact on telecom operators’ revenue from roaming services, visitor packages, and sales of handsets.

    But COVID-19 pandemic also opened new opportunities: Data demand increased owing to the increase in the number of people working from home and online education initiatives by educational institutes. Enterprise solution businesses also witnessed a positive impact due to increased demand. Mobile and fixed-line internet traffic grew by 33% M/M in March compared with that in February.

    Overall, the telecom sector was relatively resilient to the impact of the COVID-19 pandemic compared with other sectors, with total revenue (of three major operators) growing 6% Y/Y in H1-20. Going forward, when the situation reverts to normal, sector revenue is expected to grow faster, driven by an increase in investments in digitization by enterprises and rise in the number of foreign visitors.

    Oil has been the key driver of KSA’s economy until recently. In the past few years, the Kingdom has shifted its focus from oil, and it has started diversifying the economy with huge investments in non-oil sectors. The pace at which KSA has embraced new communication technologies, applications, and devices is impressive. The government’s futuristic approach and acceptance from the people has helped the Kingdom emerge as an unexpected frontrunner in ICT globally.


  41. Data Segmentation - A Route to Happy Customers, Increased Revenue

    Data segmentation is a vital process that allows organizations to derive benefits from the vast repository of data

      to read | words

    Data segmentation is a vital process that allows organizations to derive benefits from the vast repository of data they collect. Correct evaluation of data starts with accurate data segmentation, which should be error-free and relevant. The segmented data provides relevant actionable information to the different teams in a company, based on which they can develop strategies to increase revenue. Thus, the process is undoubtedly crucial for the growth of a company.

    Data segmentation is a process of classifying available data based on various parameters. The procedure involves the systematic arrangement of unstructured data for further analysis and estimation of future scenarios. A well-defined data segmentation process enables identification of high-opportunity groups within a company’s existing customer base. Customers are classified as per their demographics, purchasing patterns, and likes and dislikes, and accordingly categorized into pre-defined segments. This helps to glean insights from the vast pool of data that businesses gather and use them for strategic planning.

    Harvard Business Review, a management magazine, published a case study of a successful company, Hill-Rom. The study depicts how accurate data segmentation helped the company to increase sales, reduce cost, and increase revenue. The company’s main objective was to improve its overall economics. It focused on creating an appropriate customer segmentation model, through which it was able to determine the various requirements of each customer segment. This enabled Hill-Rom to devise customized sales techniques that catered to different customer needs. The company was able to extend its value proposition to the varied sets of customers, boost sales, enhance customer satisfaction, increase revenue outlook, and generate profits.

    Advantages of Data Segmentation:
    Data segmentations helps a company to retrieve segmented data easily for further analysis and decision making and create customized marketing messages for its target audience. Marketing and sales teams require data to contact customers and increase product awareness. Accurately segmented data enables the teams to not only approach the right customer but also plan the ideal way to pitch a product and increase sales. The teams can thus follow up on the precise sales leads generated with a targeted approach, avoiding wastage of efforts.

    Here are a few points to remember when segmenting data.

    Define the need and ROI; time the process − Data segmentation is a time-consuming process. Hence, it is important to define the need and expected ROI from the process and plan the process in an effective way to derive timely results.

    Data relevance and accuracy − The data to be segmented should be relevant, recent, and precise. Segmenting unreliable data could lead to erroneous decisions and wasted efforts. Accuracy of data collected not only helps in routing efforts in the right direction but also increases chances of gaining positive outcomes.

    Accurate implementation of data segmentation outcomes
    Incorrect implementation of data segmentation outcomes could prove to be a costly mistake. Planning and execution are both essential aspects of segmentation. Data segmentation helps understand revenue drivers. Once the customer database is segmented based on various parameters, it is crucial to regularly update the same by monitoring any trends that may influence changes in customer demand and preferences. This would ensure maximum benefits from the data segmentation process.

    Data segmentation allows companies to devise a suitable strategy for future operations. The following figures depict an exemplary analysis developed through data segmentation:

    Market Segmentation by Consumer Age

    *Primary consumer segments are in the age groups of 45−60 and 30−45.

    Sales Revenue Breakdown by Product Type

    *Product types C and E are the highest selling

    Geographical Breakdown by Sales Revenue

    *Maximum Sales is generated in the US

    A company can determine the major revenue drivers within its database through data segmentation and devise strategies to ensure customer satisfaction. This would allow the company to convey the benefits of its products and services to customers as per their requirements and thereby generate profits.

    Data segmentation reports can be generated through various methods. At Aranca, we initiate the process with a thorough examination of the details and reports that need to be segmented and their purpose. Reviewers validate the entire data and then segment it. The segmented data assists clients in core analytics, research, and developing internal strategies.

    The following image illustrates the typical delivery framework that Aranca adopts:


    Conclusion: Data Segmentation done in the right way facilitates informed decisions, and this promotes business growth. It provides clarity on execution of work. Efforts can be channelized to target key customers. Detailed data segmentation allows a company to focus on identifying the business that fits its service requirements. The process should therefore be a part of every company’s culture.


  42. Existential Risk Management – Managing the Risk of Extinction

    The global pandemic has once again bought fore the need to have risk management and business continuity plans

      to read | words

    The global pandemic has once again bought fore the need to have risk management and business continuity plans to deal with crises. As COVID – 19 spread across the world, it spelled doom for the global economy and many companies were forced to declare bankruptcy. Could this have been avoided if there was a blueprint for disaster management, readying them to face unprecedented challenges?

    Global catastrophes - from the various pandemics, sovereign defaults, liquidity crises, wide fluctuations in macro variables to a host of other unprecedented events - have exposed how fragile modern financial systems are. More recently, coronavirus has spelled death sentence for many big and small enterprises throughout the world. Businesses like airlines, tourism, hospitality, and retail are facing existential threats while other industries are facing severe challenges, some more fatal than others.

    Businesses have traditionally focused predominantly on business and associated risks. The 2007 Financial Crisis and the destruction that ensued started the conversation on managing the risks of existence and many companies formulated or strengthened their crisis management and business resumption plans. Many eventualities, such as reputational, legal, and other remote risks that were hitherto ignored and deemed too remote to consider and now receiving the attention they deserve. Recent developments in the world, from civil unrest in the United States to tensions brewing between India and China, have demonstrated the importance of preparing proactively for catastrophes that seem implausible but are probable. The chart below demonstrates spike in establishment deaths during the financial crisis of 2007-08.

    Quarterly establishment births and deaths, 1993-2015

    Source – US Bureau of Labour Statistics

    Any company which wants to safeguard its existence should establish a crisis management and business continuity function. The size of the function will depend on the scale of operations of the company. The exercise of existential risk management will involve rigorous scenario and sensitivity analysis, utilizing the advancements in data analytics and artificial intelligence (AI) as well as expert suggestions to simulate stressed circumstances. One example of a coordinated response is set out in an April 2020 report published by Accenture titled ‘Continuity in Crisis - How to run effective business services during the COVID-19 pandemic.’ The report outlines teams that helped Accenture in keeping afloat its business. Some of these teams were – Lead response team, Work from home enablement team, Robust communication team, Customer engagement team and Command centre team. Building a human + machine workforce, employing agile and elastic workplace models and establishing a resilient culture are some of the ways mentioned to build a sturdy organisation.

    Best practices for existential risk management are:

    1. Designing Crisis/Incident Management, Business Continuity, Business Resumption and Disaster Recovery plans - These plans should define the when, who, where and how a co-ordinated response will be initiated in the event of crisis. The plans must be dynamic, evolving constantly to adapt to changing environment. They must be regularly tested for effectiveness and communicated across the value chain to ensure that employees are well aware of their roles and responsibilities in case of any eventualities. Institution of robust Business Continuity Management (BCM) will ensure that the organisation recovers significantly quickly during unforeseen events, as is shown below.

      (Source – Risk Management and Internal Audit in time of Covid-19 - KPMG)

    2. Separate plans of action must be in place for different crises, as each will have a different impact on the business. Some examples of factors that can affect dissolution (challenge the going concern of an entity) and a list of catastrophes to consider are –
      • Infectious disease outbreak.
      • Breakdown of IT Infra, cyber-security attacks, data fraud.
      • Political instability, social risks such as humanitarian crisis, social unrests, popular movements, riots, terrorism etc.
      • Natural disasters.
      • Pivotal change in government policies regarding matters fundamental to the business.
      • War and subsequent embargo with countries forming a part of the supply chain. This would also involve consideration of disruption of global value chains and barriers to cross border movement of people and goods.
      • Reputational risk, bad press, loss of confidence brought on by fraud and other moral and ethical fallouts.
      • Regulatory, legal or contractual breach.
      • Abrupt obsolescence of product/technology on which the entity predominantly depends.
      • Prolongation of recession occasioned by other calamities.
      • Extreme movements in business and macro variables.
      • Extreme and sudden movement in demographics.

      For each of these scenarios there must be a separate detailed plan. Plans must Identify factors that are most likely to prove detrimental to the survival of the organisation in periods of acute stress. The crisis management plan should also chalk out separate course of actions for different durations and intensities of crises.

    3. Some of the tools for managing existential risks are:
      • Rigorous cash flow forecasting incorporating all plausible scenarios. Latest developments in AI and machine learning have enabled development of prediction models which are of great utility. Services of experts can also be availed to simulate scenarios. To ensure its robustness and usefulness, the scenario analysis must be sufficiently extensive with many nodes of possibilities at each step.
      • Stress testing business and macro variables, like sales, demand, price, raw material availability, tax rates, interest rates and carrying out sensitivity analysis on solvency and liquidity ratios, capital and other metrics detrimental to the survival of the business.
      • In addition to preparing internally for contingencies, external risk management tools must also be utilised, like – insurance, special situation bonds like catastrophe bonds and other specialised hedging tools like weather derivatives etc.
      • Plans for managing fixed costs during periods of shutdowns must be thought-out. Cash optimization to identify opportunities to decelerate burn rate and preserve liquidity should be planned. The aim is to hibernate and survive in a state of suspended animation by rationalising contractual cash outflows.
      • Working capital analysis to assess options to accelerate collections and use liabilities as a source of funding in times of stress.
    4. The aim must also be to quantify impacts and losses to better understand the severity of and facilitate comparison among different scenarios.
    5. COVID-19 has exposed the vulnerabilities of quantitative financial models (for example, expected loss provisioning, capital adequacy and risk weighted assets calculation etc.) There are several reasons for this – first, model assumptions were developed in pre-COVID era and second, the inadequacy of using historical simulation as a means for estimating future. This necessitates having models specially designed to be of use in times of extraordinary and unprecedented situations with parameters calibrated accordingly.
    6. Equally important is the recovery plan and it must be as comprehensive as time and other resources permit. The business resumption phase of the plan must consider various alternate realities of recovery and simulate the recovery. Expected support/relief measures by the government can also be incorporated if they are likely.
    7. Another layer of preparation in the form of correlation analysis could be used to consider the cascading effect of these scenarios happening simultaneously. This will render complex scenarios comparable. Interdependencies between risks and functions must be studied in some detail to anticipate the speed and extent of inter-functional diffusion and spill-over of risks.
    8. An evaluation of crisis management and business continuity plans of third-parties which are important for the existence of our business must also be carried out.
    9. A trade-off must be struck between costs and benefits of existential risk management. Plans must be scaled depending on the size of the businesses.
    10. The financial crisis of 2007-2008 has brought forward a host of other risks that were erstwhile ignored, namely – counterparty risk, wrong-way risks etc. In a crisis situation, when the stress is pervasive through the entire system, it is especially important to consider these risks.

    Some of the points mentioned here come under purview of other risks also. The existential risk management is aimed to study, anticipate and safeguard against those events (irrespective of the type of events) that are so severe so as to prove fatal to the going concern/continuity of business.

    It must be understood that an exercise like this cannot be exhaustive and can in no way completely hedge the business from all the unforeseen circumstances. Yet, we cannot give in to the vagaries and uncertainties of time and do our part in planning to secure the survival of our business during times of great turmoil.


  43. Hospital M&A Activity is on life support, but recovery is imminent

    The number of hospital deals declined in H1 2020 as the COVID-19 pandemic spooked investors, making them conserve cash.

      to read | words

    The number of hospital deals declined in H1 2020 as the COVID-19 pandemic spooked investors, making them conserve cash. With the pandemic adversely affecting many healthcare providers, many small players without a financial cushion are either forced into an M&A deal or have to declare bankruptcy. However, studies on the actual benefits of mergers and acquisitions (M&As) have made such deals less palatable for state governments, regulators, and other healthcare stakeholders. Deal makers will need to be more strategic in their deals going forward to ensure they pass through federal regulators and can survive a weakened health system

    Figure 1 No of Deals and Transaction Value of Hospitals in United States (USD Mn, no of deals)

    Source: CapitalIQ, Aranca Analysis

    After blockbuster years in 2017 and 2018, the number of hospital mergers and acquisitions (M&As) slowed down in 2019, falling 8% YoY. The average transaction value fell 29% YoY (excluding outliers). Many of the deals involved divestments as large healthcare systems attempted to streamline operations by selling healthcare facilities outside their main healthcare network or located in areas where the population does not justify the number of beds maintained.

    Consolidation has been a trend in this industry since 2010 and with ~75% of hospitals in the US already part of some hospital network, the scope for consolidation narrows further. However, hospitals are increasingly feeling the pressure of rising healthcare costs, declining reimbursement, and, in the case of rural hospitals, fewer footfalls. This pressure is expected to spur more deals as healthcare providers chase efficiency. A merger of equals can help a hospital scale up, thus reducing its total cost of care while also bringing in operational improvements and innovative medical procedures. Similarly, a small hospital selling out to a large network gains access to the latter’s supply chain, operational best practices, and financial infusions with which it can upgrade technology and the care it offers. With such benefits on the table (at least on paper), M&As offer hospitals a relatively fast, safe way to gain the efficiency they need to withstand the competitive business environment.

    The beginning of 2020 saw the COVID-19 crisis hit economies worldwide, which, in a cascading effect, weakened healthcare systems, incapacitated small hospitals, and hurt even well-entrenched players. In such an environment, the pace of new deals decelerated as companies sought to conserve precious cash and just monitor the situation.

    Covid 19 having Unforeseen Effect on Healthcare facilities
    The novel coronavirus caused significant loss to US hospitals for several reasons. These included: i) the deferment or cancellation of profitable elective surgeries; ii) increasing operating costs due to the precautionary measures implemented and the rising input prices; and iii) inadequate compensation from the government for treating patients and reserving beds. The American Hospital Association estimates US hospitals lost at least USD 200 bn between March 1 and June 30; these losses are expected to rise by at least USD 120 bn in 2H20.

    While large healthcare networks will have the financial power to weather the crisis, independent and rural hospitals that were already struggling before the outbreak hit, may not survive this phase. These small players may have to choose between joining a larger network or declaring bankruptcy.

    With the pandemic affecting the revenue and margins of both small and large hospitals, the big networks have a larger pool of targets to bid on and can also offer less costlier valuation multiples than normal. However, multiple studies on the effect of M&As on the quality of patient care and the cost involved may make companies think twice about carrying out deals rationalized by operational improvements.

    Mergers not delivering the stated benefits
    One rationale driving M&As is that large healthcare systems benefit from synergies in the form of bargaining power, optimized supply chain, additional capital investment, and cumulative expertise. However, several studies by leading researchers, including the Harvard Medical School and the New England Journal of Medicine, have concluded that such deals have no impact on patient care and, in some cases, may in fact reduce the quality of care. Such deals could also hand excessive bargaining power to the merged entity, allowing it to increase patient costs.

    A study by the Federal Trade Commission (FTC) suggests that when hospitals merge, they face less competition and are thus able to charge as much as 40–50% more on their offerings than an independent setup. Additionally, unless such mergers result in an integration of operations, patient care does not improve – or worse, declines – and the merged entity fails to derive any benefit from the decline in cost.

    For companies seeking M&As to cut costs and gain synergy, the studies sound an alarm. Such companies may need a deeper analysis to understand if the proposed synergies are attainable. For example, the financial stability of the combined entity was one of the reasons cited by Lifespan and Care New England when they abandoned their merger talks.

    Hospitals are not the only ones impacted by the revelations of the studies. State governments, federal agencies, employer groups, and others with a stake in institutionalizing low healthcare costs are now rallying against hasty, ill-thought mergers.

    Growing Anti-mergers Sentiments
    With multiple studies supporting the fact that consolidation does not always improve the quality of care at hospitals or their cost structure, federal and state governments are using their powers to ensure healthy competition in this space and adherence to certain minimum service levels.

    Anti-trust laws are already in place at the state and federal level. The authorities are now more proactive about using these powers. In January 2020, a Federal Trade Commission (FTC) commissioner said horizontal hospital mergers would not escape strict scrutiny from regulators in 2020.

    In March 2020, the FTC and the Commonwealth of Pennsylvania substantiated this claim by issuing an administrative complaint about the merger between Jefferson Health and Albert Einstein Healthcare Network.

    While M&As may serve as the last resort for many hospitals adversely affected by the ongoing healthcare crisis, the regulator have made it clear that they will not lower their bar to allow a deal through anti-trust suit, thus effectively reducing the number of options for ailing hospitals.

    On another front, the Pacific Business Group – which represents some of the largest employers in the US, including Boeing, Salesforce, Tesla, and Walmart – asked Congress to institute a year-long ban on M&As among medico groups and hospitals receiving government support to deal with the COVID-19 pandemic.

    With increasing pressure from consumers as well as employers to rationalize healthcare costs, governments and regulators are likely to veto M&As, except those deemed absolutely necessary. Deal-makers would thus have to seek alternative routes to gain the synergies they need.

    Partnerships gaining steam
    Hospitals looking for support, whether financial or operational, do not always have to end up with M&As. They could instead seek partnerships with successful players.

    One partnership model includes affiliation agreements that do not transfer risks or governance rights, thus allowing small organizations to maintain control and bigger players to save their network from risk. The smaller hospital can leverage the latter’s purchasing power, facilities, and physicians.

    Another model includes a management relationship, in which local hospital boards maintain governance and control while abdicating operational control to a third party. This allows struggling hospitals to benefit from the management experience of their more successful peers, but without losing their sovereignty.

    With authorities now scrutinizing M&As closely and the effects of the pandemic weakening the financial health of hospitals, acquirers may prefer partnerships that would reduce risks and lead to an eventual merger. Additionally, partnerships could be used to turn around loss-making hospitals and sell them after performance improves. For example, ProMedica made a bid to assume the day-to-day operations of University of Toledo Medical Center, which is currently in a financially unsustainable position.

    H2 2020 Onwards
    The onset of the pandemic shelved many hospital deals as acquirers held on to cash to weather the storm, ensure their counterparts had staying power, and to await clarity on the situation. While the number of deals could recover in H2 2020, we expect financial viability and deal synergies to form an important part of the rationale, rather than growth for growth’s sake. The pandemic has exacerbated the problems buffeting small and rural hospitals and would likely convince many of these players to consider joining a healthcare system where they can attain stability as well as find financial and operational assistance. Thus, this industry is likely to see many small hospital transactions that can slide past the anti-trust laws over the next few months. However, with about 75% of the hospitals in the US already part of healthcare systems, new deal opportunities are few. With the current challenges in the hospital industry, only the popular, financially viable players would get any deals.

    We expect bigger hospitals to choose partnerships over mergers to understand the synergy available, test their partners’ financial viability, and make any eventual merger more palatable to the authorities as well as other stakeholders.

    Figure 2 Announced Deals in H2 2020

    Date

    Parties

    Type

    Summary

    17-06-2020

    Advocate Aurora Beaumont

    Asset Merger

    Beaumont Health and Advocate Aurora Health have been exploring a potential partnership. Both organizations signed a non-binding letter of intent that paves the way to deeper discussions to create a leading health care system that would span across Michigan, Wisconsin and Illinois.

    21-03-2020

    New Hanover Regional Medical Center (Target) Atrium Health Duke Health Novant Health

    Acquisition

    Atrium Health, Duke Health, and Novant Health are currently in a bidding war to acquire New Hanover Regional Medical Center in Wilmington, NC.

    11-06-2020

    University of Toledo Medical Center (Target) ProMedica

    Partnership

    ProMedica extended an offer to take over the daily operations of University of Toledo Medical Center (UTMC). Under the proposal, the University of Toledo would retain ownership of UTMC, while ProMedica would provide management and other services.

    02-06-2020

    Lifespan Care New England

    Merger

    The companies announced they are currently discussing the forming of a new healthcare system that includes them and also Brown University.

    15-06-2020

    Garden Park Medical Center (Target) Singing River Health System

    Acquisition

    Singing River Health System announced it entered into an asset purchase agreement to acquire the 130-bed Garden Park Medical Center from HCA Healthcare.

    Source: Business Press, CapitalIQ, Aranca Analysis


  44. Are European Airlines on the Path to Recovery Post the COVID-19 Pandemic?

    The global airline industry was considerably affected due to COVID-19, owing to complete shutdown on travel. However, as

      to read | words

    The global airline industry was considerably affected due to COVID-19, owing to complete shutdown on travel. However, as the ferocity of the pandemic gradually mitigates in European countries, air travel has resumed. Various technological innovations have been proposed to help airlines and airports eliminate the spread of infection. Governments are also taking initiatives to help revive the industry. Will the European airlines be able to emerge from this crisis unscathed?

    The airline industry was one of the worst affected sectors due to COVID-19. The pandemic impacted the industry worldwide, as business activity and tourism demand collapsed, resulting in increased fixed operating costs. Airlines globally are expected to lose over USD84 billion in FY20, the highest ever, while losses for FY21 are estimated at USD16 billion, according to International Air Transport Association (IATA). The European airline industry also faced the brunt of the pandemic, as major European countries like Italy, Germany, and the UK implemented strict lockdown measures in March. Recently, Level Europe, a subsidiary of International Airline Group (IAG) Holdings, filed for insolvency and blamed the pandemic for its losses.

    European Airlines face the brunt in their quarterly earnings (In Euro)

    Source: Company websites

    Currently, a few countries within Europe have opened their economies, leading to an increase in business activity and tourism. However, quarantine measures and social distancing could act as roadblocks to recovery in air traffic. A recent IATA survey in Europe showed that 78% of people in France, 76% in Germany and 83% in the UK will not travel if quarantine is in place.

    World Tourism Organization (UNWTO) issues travel guidelines aiming for faster recovery
    The World Tourism Organization (UNWTO) released a set of guidelines to help the industry recover rapidly and become more sustainable after the pandemic. The guidelines emphasize the need to restore confidence, act decisively, and adopt digital transformation to boost global tourism.

    Some processes and initiatives that could become the new normal include the following:

    1. “Touchless” travel: This initiative could minimize contact between airport staff and passengers. Technological solutions that can aid passengers in activities like bag-drop, check-in, security, and boarding checks without touching screens or documents could be introduced. Innovative practices like biometric scans and facial recognition would become routine, enabling a convenient and faster travel experience. This initiative will also limit any possible contact with surfaces and contaminated objects. Touchless, contactless, and self-service technologies at every step of the passenger’s journey would facilitate a seamless passenger flow, thereby cutting queues while maintaining a social distancing-friendly travel experience. Touchless data-entry technologies, including gesture control, touchless document scanning, and voice commands, are already being tested.
    2. Sanitation: Industry experts suggest that passenger luggage should go through fogging or a UV disinfection process to become “sani-tagged” before being loaded. Each bag and tray should be disinfected on entering the machine through fogging, UV-ray disinfection, or other techniques. In addition to the sanitization of bags, some airports have started testing a full-body disinfection booth that disinfects a person from head to toe.
    3. Baggage check-in solutions: Despite improvements made in recent years, baggage handling continues to be a key challenge faced by airports in their pursuit of a safe, easy, and streamlined business model. Passengers can expect to see an increased use of self-service baggage solutions such as baggage drop, wherever available, to minimize physical interactions. Remote check-in solutions are expected to be implemented widely, enabling travellers to check-in and drop off their bags for any airline at different locations.

    Governments measures to revive ailing airlines and air travel
    Realizing that failure of the airline industry could impact the entire economy, various governments within Europe have launched several relief packages to keep the industry afloat. Some of them are listed below:

    • Germany has allowed all airlines to defer payments of air travel taxes.
    • Italy introduced EUR500 million COVID-19 fund that is limited to airlines having a licence issued by Italy, despite being in breach of EU rules. Sweden also excluded all airlines based outside its territory from its EUR455m loan guarantee scheme.
    • A massive sum of EUR9 billion government aid has been approved without conditions to help Air France, SAS, Condor and Finnair. The commission agreed to a diluted package of commitments in exchange for a record EUR9 billion in state aid to Lufthansa. It is expected to offer additional help; for example, the commission pledged EUR2–4 billion aid from the Netherlands for KLM.
    • Berlin agreed to a EUR9 billion deal to save Lufthansa, which will make the German government the single largest shareholder of the airline.
    • The Austrian government decided to aid Austrian Airlines and struggling national carriers with a bailout of EUR450 million.

    The EU has also given approvals for leisure or business travel from 14 countries beyond its borders: Algeria, Canada, Japan, Morocco, Rwanda, South Korea, Tunisia, Australia, Georgia, Montenegro, New Zealand, Serbia, Thailand, and Uruguay.

    From July 6, 2020, the UK would allow Britons to travel overseas and plan holidays to 90 countries. In addition to this, passengers will not be required to quarantine for 14 days on return. Ban on non-essential travel to all EU countries, as well as Australia, New Zealand, and British Overseas Territories such as Bermuda and Gibraltar, is expected to be lifted by the UK’s Foreign Office. The announcement confirmed by government officials will end discussions on the UK’s “travel corridor” policy and “air bridge” agreements that were pursued by Grant Shapps, Transport Secretary. However, travel to the US and South America is still prohibited until December 2020.

    Conclusion
    As per the data from Flightradar, the near-term aviation trends are positive with the re-opening of the global economy. Data reveals a jump in flight bookings, particularly for leisure travel, to destinations such as Spain, Greece, and Portugal for the months of July and August. Strong recovery has also been observed among travellers visiting their friends and relatives. In addition to government measures, various airlines are resorting to cost-cutting measures to stay afloat. They are luring travellers by offering return travel guarantee amid evolving COVID-19 rules and regulations around travel. A combination of these measures along with safety reassurance to passengers and staff by both airlines and airports should lead to a faster revival of European airlines.


  45. Consumer Non-durables in US Brace for Tougher Times as Economic Rampage Continues

    The COVID-19 crisis is not likely to get over anytime soon. Several countries have already declared their economies

      to read | words

    The COVID-19 crisis is not likely to get over anytime soon. Several countries have already declared their economies are in recession. Sectors like consumer non-durables have been adversely impacted as the purchase of non-essential items has completely stopped. With lockdowns disrupting supply and demand declining, there seems to be no respite for the sector in the near term.

    The speed and scale of the COVID -19 crisis has shocked even the most powerful and developed nations. The global economy has not seen a health crisis of such magnitude in the last 75 years. As of May 29th, 2020, the number of infections world-wide topped 5.9 million and the death toll was above 0.3 million and still rising. The global recession is slowly becoming a reality as countries across are struggling with complete shutdown of most business activities.

    The US currently has 0.2 million patients and the country’s economy should brace for a challenging period ahead. The global rating agency Moody’s quoted that the spread of coronavirus will adversely impact a modest portion of North American corporates. Additionally, the government plans of COVID-19 containment like widespread lockdowns has evident downside risks to various sectors including consumer non-durables such as apparel and footwear.

    Consumer spending constitutes approximately two-thirds of the total GDP in the US. As the virus spreads unabated in the country, sales of non-essential items have almost reduced to negligible. However, non-durable companies supplying frozen food and everyday essentials have benefitted from panic-buying following the outbreak. The positive trend notwithstanding, consumer spending is going to be low during the first half of the year and consumer non-durables stand to take a severe hit.

    Recent data shows that retail sales in the US slid 16.4% in April 2020 from that the previous month. Of this, the largest decline was recorded in sales of clothing and accessories (down 78.8% MoM), and electronics and appliances (down 60.6% MoM).

    To understand the trend better, it is important to compare the current performance of the consumer non-durable sector with that during the recession of 2008-09. This can be gauged from the chart below that depicts the performance of the MSCI US consumer staples index.

    MSCI US Consumer Staples

    *circled area shows slowdown period
    Source: Cap IQ, Aranca

    Despite the slowdown during both periods, the index is around 119% up in May 2020 from its low in 2008-09.

    Consumer behavior during 2008 recession versus COVID-19 situation

    2008 Great Recession

    2020 COVID-19

    Consumer Behavior

    • Reduction in eating out
    • Decrease in purchase of non-essential items (clothing and accessories)
    • Focus on savings
    • Stockpiling of essentials in order to reduce outside visits
    • Reduction in expenditure on apparel and accessories

    Consumer Attitude

    • Economic uncertainty and fear
    • Anxiety due to possible loss of livelihood
    • Extreme fear for health and well-being
    • Stress due to loss of wages and livelihood
    • Uncertainty about the future

    Macroeconomic Sentiment

    • Very negative due to increased unemployment
    • Low consumer confidence
    • Rapidly deteriorating
    • Loss of wages and mass layoffs
    • Complete shutdown of industries, collapse of financial markets

    High-demand Products

    • Consumer staples: Cereals, milk, sugar, frozen foods
    • Low-priced beverages
    • Consumer staples: Cereals, milk, sugar, frozen food
    • Hygiene-related such as paper products, disinfectants, soaps and sanitizers

    Low-demand Products

    • Discretionary food items; high- priced beverages
    • Apparel and accessories, relatively more expensive consumer non-durables
    • Fresh produce
    • Non-durables imported from impacted countries


    Sector-wise impact of COVID-19 on non-durables

    Apparel and footwear
    This is one of the industry’s worst affected by the COVID-19 crisis. The US government has issued directives on shutting down many manufacturing plants to contain the spread of the virus. Additionally, on the demand side, consumers would cut down expenditure on non-essential items like clothing and footwear. This is evident in the YTD performance (as of May 28, 2020) of some of the biggest companies (by market cap) in the industry. On YTD basis, Nike’s returns stood at -3.65%, while Columbia Sportwear Co’s. plummeted 26.78%.

    Alcoholic and non-alcoholic beverages
    So far in the pandemic-driven crisis, the impact on the sale of alcoholic beverages has been uneven. While some players recorded a surge in sales, others saw a decline. Economy spirits outsold luxury, super-premium and ultra-premium liquors. However, in terms of performance, YTD returns of almost all stocks are in red.

    Non-alcoholic beverages are facing significant challenges due to the outbreak of COVID-19. Few companies such as Coca Cola are dealing from supply side disruption as it sources artificial sweetener from China.

    Food-diversified
    Consumer food companies are tackling issues such as decreased consumption and supply chain disruption. While the direct effect on the food industry will be felt as long as the pandemic lasts, any largescale impact is highly unlikely.

    Household/personal care
    The household and personal care industry is known to be resilient to economic changes. In this case, consumers in most countries affected by the virus began stockpiling essential household items. Specifically, demand for paper-based products has surged. However, significant supply disruption can be experienced if the lockdown in infected countries continues for a longer period.

    Anticipated impact on consumer demand industry-wise

    Category

    Consumer Behavior

    Impact

    Personal care essentials: Handwash, sanitizers, paper napkins, disinfectants, etc.

    • Panic buying
    • Stockpiling
    • Higher usage due to lockdown and more cleaning

    Positive

    Emergency essentials: Toilet paper, feminine hygiene products etc.

    • Panic buying
    • Stockpiling
    • Higher usage due to lockdown as all members are at home

    Positive

    Food staples with higher shelf life: Cereals, canned food items, etc.

    • Stock piling
    • Higher usage

    Positive; however, sales may dip in the near term as condition stabilizes

    Snacks: Chips, cookies, etc.

    • Stockpiling
    • Higher usage due to lockdown as all members are at home
    • Binge watching also to result in higher usage

    Positive

    Frozen foods: Vegetables, meat, ice cream, etc.

    • Higher consumption but lesser than food staples and snacks due to limited freezer space

    Positive; however, lower impact than the two categories mentioned above

    Daily use essential food items: Milk, eggs, other dairy products

    • Higher usage due to lockdown

    Positive

    Flours and sugar

    • Higher consumption
    • Increase in baking as an activity to keep oneself occupied amid lockdown

    Positive

    Farm produce: Fruits, fresh vegetables, etc.

    • Citrus fruit consumption likely to grow amid increasing intake of vitamin C required to boost immunity
    • Higher consumption due to increase in cooking at home

    Positive

    Non-alcoholic beverages: Soft drinks, juices, etc.

    • Significant increase in consumption amid lockdown

    Positive

    Alcoholic beverages

    • Consumption likely to increase initially due to lockdown and resultant stress; however, consumption of luxury liquor expected to decline amid financial constraint

    Mixed

    Apparel and footwear

    • Decline in purchases due to complete lockdown and financial constraint

    Negative


    Stock performance of highest revenue earners sector-wise (Currency in USD)


    The performance of the top earning stocks is in line with consumer behavior. PepsiCo Inc. is the least impacted of the three, with YTD performance at -4.2%. Nike’s returns are the lowest among the three.

    Top picks based on profitability and credit strength

    Household and personal care

    Company Name

    Total Revenue [LTM] (USD mm)

    EBITDA Margin % [LTM]

    Net Debt

    EBITDA

    FCF

    Finance Cost

    Net leverage (x)

    EBITDA Coverage (x)

    The Procter & Gamble Company (NYSE:PG)

    69,594.0

    26.9

    22,786.0

    18,749.0

    12,951.0

    (450.0)

    1.2

    41.66

    Kimberly-Clark Corporation (NYSE:KMB)

    18,450.0

    21.3

    7,738.0

    3,936.0

    1,527.0

    (261.0)

    2.0

    15.08

    The Estée Lauder Companies Inc. (NYSE:EL)

    15,853.0

    22.1

    4,272.0

    3,498.0

    1,756.0

    (134.0)

    1.2

    26.10

    Colgate-Palmolive Company (NYSE:CL)

    15,693.0

    25.5

    7,577.0

    4,005.0

    2,798.0

    (192.0)

    1.9

    20.86


    Food and beverage

    Company Name

    Total Revenue [LTM] (USD mm)

    EBITDA Margin % [LTM]

    Net Debt

    EBITDA

    FCF

    Finance Cost

    Net leverage (x)

    EBITDA Coverage (x)

    PepsiCo, Inc. (NasdaqGS:PEP)

    67,161.0

    18.7

    27,890.0

    12,579.0

    5,417.0

    (1,135.0)

    2.2

    11.1

    Archer-Daniels-Midland Company (NYSE:ADM)

    64,656.0

    3.99

    9,065.0

    2,580.0

    -6,280.0

    (402.0)

    3.5

    6.4

    Tyson Foods, Inc. (NYSE:TSN)

    43,027.0

    9.55

    11,749.0

    4,110.0

    1,286.0

    (483.0)

    2.9

    8.5

    The Coca-Cola Company (NYSE:KO)

    37,266.0

    32.2

    32,991.0

    11,990.0

    8,417.0

    (946.0)

    2.8

    12.7


    Footwear and apparel

    Company Name

    Total Revenue [LTM] (USD mm)

    EBITDA Margin % [LTM]

    Net Debt

    EBITDA

    FCF

    Finance Cost

    Net leverage (x)

    EBITDA Coverage (x)

    NIKE, Inc. (NYSE:NKE)*

    41,274.0

    14.4

    3,474.0

    5,860.0

    3,426.0

    (124.0)

    0.59

    47.26

    V.F. Corporation (NYSE:VFC)

    14,313.9

    16.4

    2,952.8

    2,345.2

    812.49

    (89.7)

    1.26

    26.14

    Ralph Lauren Corporation (NYSE:RL)

    6,391.4

    15.6

    914.0

    996.5

    584.20

    (17.9)

    0.92

    55.67

    Skechers U.S.A., Inc. (NYSE:SKX)

    5,242.5

    12.0

    341.4

    630.0

    190.45

    (7.5)

    0.54

    83.99


    Conclusion
    Most non-consumer durable companies in the US are working with a sense of urgency as they look to ensure safety of employees as well as meet the requirement of consumers. They are also struggling to keep products high in demand on shelf, despite challenges related to production and supply disruption. There is no certainty about when things will normalize in the US and globally. Regular production and supply chain operations are not likely to resume before 2–3 months. Food, beverage and essentials are not likely to be impacted significantly, as their existing stock is sufficient to meet demand in the market over this period, until of course supply diminishes. However, apparel and footwear are expected to bear the brunt of the COVID-19-induced recession.


  46. Will Private Equity Firms Emerge Unscathed from the COVID-19 Crisis?

    COVID-19 has negatively affected almost all sectors of industry. Many bore the brunt of the pandemic, with lockdowns

      to read | words

    COVID-19 has negatively affected almost all sectors of industry. Many bore the brunt of the pandemic, with lockdowns and restricted travel ringing up losses. The private equity business is no exception; many ongoing deals, and several more in the pipeline, are now paused. The business, which was on the upswing, will now be hit due to this turmoil. However, there are some factors favoring the PE space. If participants can take steps in the right direction, they may be able to emerge from this crisis with minimal damage.

    The unprecedented scale of the COVID-19 pandemic has caused social, economic, and geopolitical imbalance worldwide. The rapid spread of the virus across the globe has forced countries to seal borders and order lockdowns within their perimeter. The need for social distancing has thrown economies into a tailspin and recession is slowly creeping up on countries and sectors.

    Private equity (PE) deals are yet another segment of business to be hit by the pandemic as companies grapple to survive the situation. Investments and deal activities in upcoming months might decline in terms of value and volume. In this time of uncertainty, funds are obviously wary of mis-stepping, pushing back or even halting new deals. They are now focusing on current investment portfolios to maximize returns.

    PE firms are rich in cash, sitting on a pile of US$2.4 trillion of dry powder, enough to maintain the existing portfolio and also to deploy capital at attractive valuations. Transaction volumes would slow down and ongoing deals are likely to generate capital calls soon.

    PE Dry Powder ($ billion)

    Source: Preqin

    Both buyouts and growth equity will be affected earlier than other markets due to their higher correlation to public markets. Companies and industries with recurring revenue models, as opposed to transactional revenue models, will likely fare better, at least in the short term. Small companies will be the most challenged to survive a sustained downturn.

    The private markets industry has amassed $2.4 trillion in dry powder, primarily concentrated in buyout strategies

    Source: Cobalt as of 9/30/2019

    PE firms and their portfolio companies come into the crisis riding a decade-long wave of growing transaction volumes, valuations, and fundraising. This position of strength may prove a bulwark in the months ahead, especially for firms that have recently exercised prudence. Seeing the decrease in deal count after Great Financial Crisis, we expect this trend to re-emerge in the post-COVID-19 era. Due to the lockdown and limited business activities, deals will surely slow down, following the trend of GFC.

    Global buyout deal count

    Notes: Includes add-ons; excludes loan-to-own transactions and acquisitions of bankrupt assets; based on announcement date; includes announced deals that are completed or pending, with subject to change
    Source: Dealogic

    Global Private equity buyout volumes hit post-financial crisis high
    Deal value, year-to-date($bn)

    Source: Refinitiv (formerly Thomson Reuters)

    During these tough times, PE firms need to winnow their portfolios and determine which companies need immediate course corrections.

    Defensive strategy for PE firms

    1. Assess investment strategy and asset allocation – Changes in financial markets and equity valuations are reason enough to reassess portfolios. Firms holding dry powder can explore investment opportunities that may turn out more profitable. Debt or rescue financing will be popular as many companies suffering in the aftermath of the pandemic may be seeking support. PE firms should consider investing in those companies that have weathered these tough times well due to their disruptive nature. An agile process is needed to quickly grab opportunities when they arise.
    2. Limited partners and stakeholders – Due to the unprecedented nature of the crisis, limited partners (LP) will look at investment managers for support and guidance. PE firms can help with risk management and preparedness to handle adverse situations. They should also ensure that all stakeholders are adequately informed about the trouble companies are facing and have a plan of action to deal with these issues.
    3. ESG investment – The humanitarian aspect of this pandemic has forced an evolution of customers’ expectations from businesses. Firms should evaluate their commitments to environment, social, and governance (ESG) related investing. As responsible corporate establishments, they can gain more support from their stakeholders.
    4. Priorities of PE firms – The priorities of PE firms are as follows.
      • Ensuring safety of workforce without compromising productivity – Firms would require strong technical infrastructure that can support the work-from-home (WFH) initiative. All team members should have access to the issue management and escalation matrix to ensure seamless management of activities. Open communication channels will also enable the workforce to be productive, even if they are not on site.
      • Managing financial risks, liquidity crunch – PE firms must assess financial stability based on the latest economic outlook. Companies should have their financial experts develop a cash management strategy and review liquidity and repayment risks. This can help companies monitor their financial situation.
      • Streamlining operations – Maintaining supplier chain transparency, estimating inventory, and optimizing the limited production levels are steps needed to streamline operations. Companies must safeguard employees’ health, but also deliver on customers’ expectations.
      • Communicating, remaining connected with customers – Communicating with customers is critical in the current scenario. Informing customers about the company’s practices related to COVID-19 and sharing situational communications would be effective methods to remain connected.
      • Preparing for resumption of activities, aligning company for further growth – It is essential for companies to reassess overall strategy and align budgets and goals to the current environment; they need to review and prioritize capital investments. Companies must develop a post-recovery exit plan and also explore growth prospects.

    Conclusion:
    Every industry will be faced with some hard-hitting decisions in the wake of the pandemic. If PE firms can devise and implement robust strategies, they can get through the crisis without too much detriment. The steps mentioned here can guide them in taking a systematic route and readying themselves for the new normal that will set in after the pandemic fades out.


  47. Chinese Industries Adversely Affected by COVID-19

    The COVID-19 pandemic has created an economic turmoil. Industries across sectors are impacted as a result, and nations

      to read | words

    The COVID-19 pandemic has created an economic turmoil. Industries across sectors are impacted as a result, and nations are preparing for the worst recession of the century. As the virus originated in China, it was the first country to feel the economic repercussions of the outbreak. Some sectors in the country were badly hit and may have to face the cascading effect of the virus as well. It seems that the worst is yet to come.

    COVID-19, which emerged in China, has been a disaster at both the humanitarian and economic levels. Forced lockdown across nations has brought the global economy to its knees. Some of the largest economies – the US, China, Japan, Germany, UK, France, and India – are bracing themselves for the tough times ahead as IMF has already estimated a downturn for the global economy in 2020. Though the pandemic has adversely impacted almost all sectors, the most severely affected ones in China are manufacturing, automobile, petroleum, entertainment, and tourism.

    Manufacturing
    To contain the spread of the virus, various enterprises delayed the reopening of work and production for a substantial time period. As a result, companies faced shortage of manpower and economic activities were interrupted, leading to reduced production. The pandemic also upset the operation plans and schedules of factories.

    The manufacturing industry is an asset-heavy one, and though operations are suspended, companies have to pay social security, taxes and rent, factory building operation, and loan and interest. Several small- and medium-sized manufacturing businesses with high loans and low cash flows are unable to sustain themselves and may have to close down their shutters.

    However, with a marginal improvement in the situation, organizations are resuming production, and the government is establishing policies to support the industry and ease its burden. Many manufacturers took this opportunity to streamline their production lines to manufacture the much-needed medical and protective supplies, which are also being exported to other countries.

    Chinese Manufacturing Heavily Affected By COVID-19 Outbreak

    Change in value added by selected manufacturing sector of China in Jan-Feb Vs 2019
    Source: National Bureau of Statistics of China

    Automobile
    The automotive industry is also facing the brunt of the pandemic. Production is on hold temporarily as domestic and international supply chains are blocked. As a result, demand has collapsed. Experts predict that the impact of coronavirus on smaller companies engaged in the manufacturing of car parts and components could be higher as they are most vulnerable.

    Vehicle sales increased 4.4% YoY to 2.07 million units in April 2020, the first rise since June 2018, as the country released coronavirus-related limits and reopened for business. The Feb month witnessed a 79% fall, which was the sharpest yearly decline on record. The sale of new energy vehicles, including plug-in hybrids, battery-only electric vehicles, and those powered by hydrogen fuel cells, fell for the tenth straight month to 72,000 units.

    The China Association of Automobile Manufacturers estimates vehicles sales to decline by more than 25% in the first half of 2020 and by approximately 15% by the year end.

    China Motor Vehicles Sales
    Units (in Mn)

    Source: CEIC

    Petroleum
    China is the world’s second largest oil consumer and the biggest importer. Due to lowered requirement, the country saw a decline in demand. Consequently, it led to a sharp drop in international crude oil prices.

    The drop in oil prices led to a crash in stock prices and caused a turmoil in US markets. The crude oil prices are already at an all-time low, and there is a risk of prices falling further.

    Since China is now in the recovery stage, its major national oil companies are set to pursue their domestic output growth goals.

    Oil Price in 2020
    Brent Crude, US dollar per barrel


    Entertainment
    Another casualty of COVID-19 is China’s film industry. The prestigious Spring Festival film season had to be cancelled due to the enforcement of lockdown. The film industry has lost CNY 1.65bn this year. The film and entertainment industries, including concerts, sports events, and exhibitions, are still shut down.

    Tourism
    Since December 2019, all tourist sports and theme parks have been closed. Most flights were cancelled and hotels remained vacant except when being used to isolate patients. The country had witnessed a similar situation in 2003, when many small hotels had to close due to the SARS epidemic. This situation may reoccur. Currently, all four- and five-star hotels have a high vacancy rate and are suffering huge losses.

    The tourism sector also missed the Spring Festival Golden Tourism Week, one of the most profitable weeks for this sector, along with Labor Day and National Day holidays. A large number of small- and medium-sized businesses as well as tourist agencies have recorded significant losses. As international borders remain sealed, tourism will be further affected.

    China announced that it has managed to dissipate coronavirus and does not have any new cases. However, the aftereffects of the virus remain. The fear of a second or third wave hitting the country is also real. Hence, the question “Will these industries be able to recover soon?” remains unanswered.


  48. Long-Term Trends Likely to Emerge in TMT Sector as an Aftermath of COVID-19

    COVID-19 has led to increased usage of internet as well as technology, media, and telecom (TMT). As the

      to read | words

    COVID-19 has led to increased usage of internet as well as technology, media, and telecom (TMT). As the virus continues to force nations to remain under lockdown, these trends will be long-term and may become part of the “new normal.” While the developed countries already had a large base of online users, they still saw a surge in numbers. The emerging nations are continuing to see a rise and yet have unexplored potential that could lead to further growth.

    COVID-19 has affected 216 countries so far with more than 4.2 million reported cases and 0.3 million confirmed deaths. The need for social distancing has led to lockdown in countries until the situation improves. Currently a third of the world’s population is confined within their homes. Moreover, theaters and shopping malls have closed while social and religious gatherings are prohibited. Due to this forced isolation, people are resorting to engaging themselves virtually and spending more time online. While a sizable number of people are watching more shows and films on streaming devices, others have taken to social media or messenger services. As per an April Global Statshot Report by Hootsuite on survey of internet users between 16 and 64 years in countries that have observed strict lockdown, 57% of internet users watched more shows and films on streaming devices, 47% spent longer time on social media, and 46% were engaged with messenger services.

    Activity wise percentage of internet users* reporting spending more time in recent weeks

    Source: “April Global Statshot Report” by Hootsuite; * aged 16– 64 in select countries

    This shift in consumer behavior could well become a habit, as research indicates that it takes roughly a couple of months for a new behavior to become an “automatic habit.” Accordingly, recurring consumer behavior like playing games, buying grocery, or streaming videos online could become a habit if there is a prolonged lockdown. Most countries have been on lockdown for over a month. India has implemented the world’s largest lockdown and extended it twice, taking the cumulative period to almost two months, and many countries could follow suit. The Hootsuite report further shows that 20% of internet users will continue with the new behavior of watching more shows & films on streaming even after the lockdown is lifted, followed by 15% who would spend longer time on social media and 16% on messenger services.

    Percentage of internet users who expect to continue with new behavior even after COVID-19 ends

    Source: “April Global Statshot Report” by Hootsuite; * aged 16– 64 in select countries

    Social distancing has prompted a lot of companies worldwide to implement work from home (WFH) policy for the safety of their employees. A Gartner survey of 229 HR leaders revealed that 50% of organizations had 61–80% of their workforce working from home during the pandemic. About 15% of organizations had more than 81% of their employees reporting from home. Until a vaccine is developed, many companies globally may adopt a gradual back-to-office strategy during the year, while others may continue to allow their employees to WFH for a longer period. Companies such as Google, Facebook, Amazon, Microsoft, Slack, and Zillow have already allowed their employees to WFH until as early as September to as late as December 2020. The Gartner survey further stated that the 30% of workforce that exercised WFH options before the pandemic may rise to 41% now. Over the course of the year, as several companies continue to monitor the benefits of WFH, especially from a productivity perspective, there may be an inclination toward adopting WFH policy indefinitely.

    Taking into consideration the behavioral shifts, the following five long-term trends could benefit TMT companies:

    • Streaming media companies to witness increased penetration in emerging countries: Subscription video on demand (SVoD) coverage in emerging nations, which was at 1.3% in 2014, was expected to increase to 6.4% of households by 2019, according to Allied Market Research. This is substantially lower in comparison to developed countries. For instance, the penetration rate in the US exceeded 70% during the pandemic. With many developing countries staring at a prolonged lockdown situation and people spending excessive time on streaming media, SVoD companies are expanding their footprint in these markets to attract new customers. For example, Disney entered Indian markets through Hotstar, the most popular streaming service in the country. Localized content and discounted rates, supported by growth in broadband infrastructure and improvement in network performance, will likely increase the average daily traffic. Furthermore, a subscription-based model will develop stickiness to such services in terms of many new subscribers.
    • Ecommerce to push retail sales, especially grocery, from offline to online: The pandemic has forced a number of people to become first-time online buyers worldwide, such as baby boomers who used online shopping service to buy groceries. As of April 2020, as per the Hootsuite report, ecommerce web traffic to supermarkets grew at a remarkable 251% in the week to April 15, 2020, compared to that in the first six weeks of 2020. Online grocery penetration is still in the low- to mid-single digits in most countries. The global penetration rate for online grocery was 5.1% in 2018 as per Kantar. As against that, countries such as Brazil and India recorded a paltry 0.1% penetration rate during the same period. The pandemic has fueled the adoption of online sales, and with increasing customer acceptance, there are substantial growth opportunities.
    • Gaming companies to benefit from growing demand for digital games: Gaming has become a popular activity with a large internet base, following the lockdown. According to Hootsuite report, over a third of internet users aged between 16 and 64 have spent more time on video games in recent weeks. This percentage rose to 43% for male internet users in the 16–24 age group. Spending on digital games also stood at US$ 10 billion globally versus US$ 1.5 billion for a premium console and US$ 0.57 billion for a premium PC in March 2020, as per Statista. Countries such as India have a tremendous potential for growth of digital gaming. In a country where people spend more time on their mobiles, it is not surprising that India’s contribution to mobile game app downloads were the highest worldwide in 2019 at 13%. Extended lockdown, coupled with low entry barriers and a growing user base, offers a great opportunity for gaming companies to leverage.
    • IT software and services could see increased demand: Many have been compelled to WFH owing to COVID-19, resulting in greater usage of collaboration tools and software or cloud-based services. According to a GlobalWebIndex April 2020 survey on work behavior in the US and UK, 59% of workers felt that collaboration tools are essential for working productively from home. Data security was also highlighted as an important factor to consider in the survey. In terms of WFH preparedness, other than the IT/tech/software sector, most other sectors were not equipped to operate with a fully remote workforce. The survey further showed that 48% of workers in the industrial space, 33% in hospitality/tourism/travel, and 25% in education felt their companies were not equipped to work with a fully remote workforce. In developing countries, the situation is even more critical as lockdown may be extended. For instance, as per a recent EY survey titled “HR resilience planning – COVID-19 impact and preparedness,” 72% of organizations expect the impact to last beyond six months, and 70% consider the fall in productivity to be the biggest concern. The survey also revealed that less than 50% of organizations are prepared to manage this unprecedented crisis. While near-term prospects look bright for IT software and services companies, demand could accelerate further if companies opt for WFH as the new normal in the post COVID-19 era.
    • Telecom companies to benefit from speedy rollout of 5G: Social distancing has led to people spending more time on online activities such as streaming movies, video chatting, gaming, or meetings that put a strain on the network, resulting in lower download speed. Based on an April 2020 update on tracking COVID-19’s impact on global internet performance released by Ookla, global download speed for fixed line and mobile decreased 2% and 3%, respectively, in the week ended April 27, 2020. Internet speed was sluggish, particularly in countries where mobile internet users were substantially higher than fixed line users. For example, India, which has a huge mobile broadband user base, witnessed a significant decline (12%) in mobile download speed during the same week. 5G can eliminate the congestion and latency issues by delivering faster mobile networks compared to earlier generations. Moreover, telecom companies, such as Verizon, believe that sustained network usage will prevail in the foreseeable future. Hence, customers could perceive 5G as a necessity rather than a luxury, and its faster rollout and adoption would benefit telecom companies.

    The longer the lockdown lasts the more evident such trends will become. Some trends such as online grocery shopping or subscribing to video on demand will be visible sooner rather than later. While others may take a little longer as certain important factors, for example, data security and measuring productivity for working remotely and availability of 5G-enabled smartphones for better network connectivity, are addressed. Nonetheless, initial signs of shift in consumer behavior are already visible.


  49. Zeroing in on the Right Approach to Innovation

    Innovation is the crux on which growth depends in every domain. In business, companies can take recourse to

      to read | words

    Innovation is the crux on which growth depends in every domain. In business, companies can take recourse to different means of innovation. However, it has to be planned—identify the problem and then come up with a solution.

    Companies resort to design thinking and innovation while reengineering current processes or working on a new offering. Design thinking is the correct way of approaching innovation to ensure it is effective. This is typically the case with large technology corporations such as Microsoft, Apple, IBM or even Google, defined as innovative companies. However, irrespective of its size, any enterprise keen on evaluating and changing its existing operational framework can choose this approach.

    Einstein said, “We can’t solve problems by using the same kind of thinking we used when we created them. In addition, with the rapid changes in society, the methods we have previously used to solve many of the problems we face are no longer effective. We need to develop new ways of thinking in order to design better solutions, services and experiences that solve our current problems.”

    Design thinking is based on this fundamental principle. Referred to as a ‘hands on approach’, the first step in design thinking is to identify the problem and ascertain its implications through research.

    Design thinking entails:


    1. Empathetically understanding the user’s needs and context
    2. Defining the problem by asking questions
    3. Having the right conversations to generate ideas for addressing the problems identified
    4. Generating multiple solutions by experimenting
    5. Using a structured and facilitated process

    Thinking minds like Elon Musk, founder of SpaceX and Tesla, opine that the difficult part of innovation is not coming up with the answer to the problem, but coming up with the right question to define the problem. The inability could be due to not comprehending the issue correctly. Therefore, as a first step, it is important to understand the problem from the user’s perspective. Thereafter, it should be meaningfully expressed in the form of a problem statement, also known as point of view statement. This can be arrived at based on dialogues with key people directly affected by the issue.

    Next in line is ideation. Teams are challenged to broaden their creative vision and look at a range of solutions. The goal is to not just find the best solution but all possible solutions. This helps in prototyping and testing, as the organization has alternatives ready. The enterprise must encourage out-of-box thinking. During experimentation, the alternatives undergo the first round of check to determine the feasibility of taking them up for prototyping.

    Under prototyping, a working sample based on ideas generated by the team is created. A prototype is like a demo or test model, which helps in quickly testing the possibilities. The benefit of prototyping is that the idea can be tested with minimal investment of resources. If it fails, the organization has nothing to lose—rather, it gets to learn from the mistakes.

    According to Harvard Business Review, design thinking promotes learning from failure.

    All in all, design thinking is a structured process.

    Any innovation must deliver on three counts to qualify as successful: it must be a quality solution, should lower risk and cost, and must get employee buy-in.

    There are four types of innovation:


    Architectural innovation
    The company takes/applies its existing skills and technology to a different market. An organization can thus expand or increase its customer base across geographies rapidly. As the skills have already been tested successfully in other markets, the risk in trying out a new market is low.

    Radical innovation
    The company develops a revolutionary technology, which leads to the creation of a new product and entirely different category. Airplane, for instance, is once such invention that revolutionized travel.

    The cost as well as return on investment is high, as innovation entails development of new products and services with significant impact.

    Incremental innovation
    The is the most common form. The existing technology infrastructure is leveraged to come up with innovative products/services that provide more value to customers. Either new features are added to existing products or services or these are modified to make them more user-friendly and simple.

    Disruptive innovation
    Also known as stealth innovation, it entails launching a new technology or process that can render previous solutions in the same category obsolete and thereby change the entire industry.

    For example, Apple’s iPhone is often considered a disruptive innovation. Its first touch screen phone changed the way phones were being designed and ushered in the era of smartphones.

    Another type in this category would be to enter a new market or completely change the internal corporate structure, transforming operations and making processes digital.

    At times, companies are compelled to adapt to disruption due to changes in the industry landscape. When online banking was introduced, banks had to adopt digitalization in order to remain relevant.

    Innovation does not necessarily mean creating new technologies to become a market leader. Leadership can be acquired even by adopting new technology and implementing it effectively. Whatever be the means, the objective should be to provide a solution that is relevant and cost-effective.

    Conclusion
    Design thinking and innovation have become the way of life for many companies. Besides nudging us to think differently while strategizing, these approaches also help garner employee buy-in and thereby promote engagement at workplace.


  50. All that Glitters is Gold

    Gold remains a haven for investors as it is not adversely impacted by the COVID-19 outbreak. The rising

      to read | words

    Gold remains a haven for investors as it is not adversely impacted by the COVID-19 outbreak. The rising gold prices of 2019 are continuing their upward trend in 2020, reaching new highs. The demand pattern of this precious metal is shifting, and the supply side is now facing constraints. Yet, gold could well be the savior that investors need to safeguard their money.

    The year 2019 was ‘golden’ for the precious metal as its prices rose 18.3% YoY. Gold prices further continued their climb in 2020, touching multi-year highs and leaving traders and investors divided over potential future returns from the yellow metal. In 2019, gold prices breached the USD1,500/ton mark for the first time in six years as investors increased their investment in gold, driven by economic uncertainties caused by geopolitical tensions such as the US-China trade war, Brexit, the Hong Kong protests, US-Iran relations, and terrorist drone attacks on Saudi oilfields. Gold prices continued to rise in 2020 as economic uncertainties spiraled up with the onset of the COVID-19 pandemic. With most economies facing imminent recession, global equity markets sinking, and oil markets crashing, the only safe haven for investment seems to be gold.

    The current economic turmoil has made ‘risk averse’ the new mantra in the investment space. From individual investors to asset managers, all are rushing to buy gold, the safe haven since time immemorial. Gold has a low or negative correlation with most asset classes and therefore is an important element when seeking portfolio diversification. It is a unique substance and though it finds limited usage in the industrial applications as opposed to the other commodities, it has great storage value. Many still consider the yellow metal an alternate global currency. Besides, gold offers deep liquidity, being recognized worldwide as a precious metal, unlike paper money, which is based on a promise of repayment. An old adage says “gold is the only financial asset that is not simultaneously someone’s liability.”

    Gold price movement against S&P 500 and USD Index (Rebased)

    Source: Bloomberg

    Shifting pattern of gold demand
    The demand for gold arises from areas as diverse as jewelry, technology, investment, and central banks. It is a great asset for all segments of users and assumes importance for them at various points in the economic cycle.

    According to the World Gold Council (WGC), the pattern of demand for gold changed significantly during 2019; the surge in gold-backed exchanged traded funds inflows added 401 tons during the year, taking ETF holdings to an all-time high of 2,885.5 tons. In dollar terms, annual net inflows of USD19.2bn and an 18% rise in gold price together raised the assets under management to USD141.1bn by the end of 2019. In Q1 2020, gold ETF attracted huge inflows (298 tons), which pushed global holdings of these products to a new high of 3,185 tons. Soft monetary policies and low to negative interest rates, geopolitical uncertainties, and momentum-driven inflows (because of rising gold prices) have been key reasons for the rising interest in gold.

    Meanwhile, demand from the consumer segment declined steeply due to the high price of the metal. In fact, the jump in ETF inflows helped offset the weakness in consumer demand, which slipped 6% YoY in 2019. In 2020, the global demand for jewelry plummeted 39% YoY to 325.8 tons due to the COVID-19 crisis and surging gold prices.

    ETF inflows compared to the demand for jewelry fabrication (Tons)

    Source: Bloomberg

    Central banks mark 10 years of net gold purchase
    The year 2019 also marked the tenth consecutive annual period in which central banks of several countries remained net purchasers of gold, adding 650.3 tons during the year as per WGC. This figure was marginally shy of the all-time high of 656.2tons in 2018, since the dollar’s convertibility to gold was stopped in 1971 following an end to the Bretton Woods system. During the current decade, central banks of many nations have added 5,019 tons back into official gold reserves globally, with an annual average of 492.0 tons, compared with average annual net sales of 438.9 tons in the preceding decade. Clearly, gold’s role and relevance in the global economy have resurged since the 2008 financial crisis as the period thereafter brought on escalating trade wars, armed conflicts, and low or negative interest rates. Central banks have responded with higher allocations to gold in their reserve portfolios. Even in Q1 2020, central banks continued to accumulate gold, albeit at a slower pace.

    Annual net purchases by central banks (Tons)

    Source: World Gold Council

    It is noteworthy that during 2019, 15 central banks increased their gold reserves by at least 1 ton. This demand comes from the central banks of emerging economies seeking to bolster or diversify their overall reserves. As the global economy becomes more interconnected than ever before, the performance of the US economy, and even the US dollar (the dollar), cannot be studied in isolation. Even though a collapse of the dollar seems implausible, central banks may want to shore up their reserves by adding gold to the mix. Also, there have been instances where major economies such as Russia and China have tried to bypass the dollar-denominated payments owing to the trade tariffs and sanctions imposed by the US, which hinder the development of other economies. The US is known to wield its currency as a weapon to make other countries fall in line with its terms. Furthermore, the debt burdens of emerging economies are magnified by the strength of the dollar; the local currency’s weakness handicaps these countries as they are required to repay loans with depreciated currency.

    Future supply side trends make an interesting case for the value of surface gold
    Gold is a rare metal that occurs in a natural molten state under the earth’s surface. Until date, about 190,000 tons of gold have been extracted from the earth. But the setting up of new gold mines has been declining since 2000. This could also be attributed to the high costs associated with new mines and the shrinking exploration budgets of mining companies. Gold exploration is an expensive process and any new mine requires a lead time of 10–20 years before it can produce material that can be refined and commercialized. In terms of growth, mining companies need to explore new mines to ensure future income.

    Gold Exploration Trends

    Source: S&P Global Intelligence

    On the contrary, mining companies are now allocating a greater proportion of their exploration budgets to mines with proven assets. This could help reduce their risk exposure during an economic downturn and ensure returns on their investment. The S&P Global Intelligence points out that there have been an average of only 54 initial resources from 2015–19 compared to 94 from 2010–14. The size of initial resources is also diminishing; the 176 initial resources reported since 2015 have an average endowment of 559,037 ounces, whereas the 271 resources reported during 2010–14 averaged 835,000 ounces, with less spending towards the grassroots-level of exploration (even the largest of mining companies allocate less than 0.5% of their budgets to what is known as “grassroots” exploration). Global miners are instead looking at mergers and acquisitions to consolidate market positions as the gap between the exploration price index and the pipeline activity index widens, making it tougher for existing mines to increase their production organically. Some prominent mergers are the Newmont-Goldcorp merger (formed the world’s largest gold-producing company) and the Barrick Gold and Randgold merger.

    In 2019, the annual supply of gold increased 2% to 4,776.1 tons. This was achieved purely from recycling and hedging as mine production worldwide slipped 1% to 3,463.7 tons. In Q1 2020 as well, mine supply was hit due to the COVID-19 outbreak, which forced mine closures to stem the spread.

    What this means for gold investment
    We can safely assume that any future gold mining, an inherently expensive process, is likely to produce diminishing output. However, due to its scarcity, the metal will hold value interminably as gold still seems an undervalued asset given the supply demand mismatch. We expect gold prices to remain at the current levels, or even go up further, considering the COVID-19 crisis, ensuing economic uncertainty and the aftermath of bailout packages from central governments that wish to salvage their crumbling economies. Central banks may try and infuse liquidity by printing more money or lowering interest rates which will further push investors to demand more gold. Therefore, despite the short-term headwinds, the long-term story of gold remains intact.


  51. Global Dollar Shortage: Back and Here to Stay

    Amid the COVID-19 pandemic, demand for dollar – the global reserve currency – has increased. The recent turmoil in financial mar

      to read | words

    Amid the COVID-19 pandemic, demand for dollar – the global reserve currency – has increased. The recent turmoil in financial markets, a lack of liquidity and falling global trade has led to the strengthening of the US dollar vis-à-vis other currencies. The Federal Reserve has responded aggressively with interest rate cuts, quantitative easing and establishment of swap lines with major central banks to ensure liquidity and that the foreign exchange market functions smoothly. However, the measures proved inept in preventing the dollar index from touching an 18-year high. Is the dollar shortage a long-term scenario or a kneejerk reaction? Read on to find out.

    The spread of COVID-19 pandemic impelled a worldwide rush to buy US dollars as the global trade suddenly ceased and financial markets fell sharply due to massive asset liquidation. From early to mid-March, the Dollar index rose sharply, reflecting unprecedented outflow of capital from emerging markets amid the highly uncertain and volatile environment. Investors were selling almost every asset and trading even in the usually very liquid markets for Treasury and agency mortgage-backed securities (MBS) were impaired. The short-term funding market was almost frozen. As investors looked for safe havens and dollar liquidity to meet their financial obligations, demand for the US dollar surged suddenly.

    Many countries are struggling to service their dollar-denominated debt, as dollar inflow has stopped with international trade collapsing and commodity prices taking a hit. More than 102 countries have already approached the IMF for emergency funding in a bid to safeguard their economies from the shortage of the dollar.

    The Dollar Index (DXY)

    FED Broad Trade Weighted U.S. Dollar Index

    Source: Bloomberg, Federal Reserve

    What’s driving this sharp rise in demand for US dollar?
    Governments around the world depend heavily on the dollar, which constitutes about 61% of central banks’ foreign exchange reserves and 40% of invoices. According to Bank of International Settlements, over the past decade, dollar-denominated foreign debt doubled to $12.1 trillion, or 56% of the US GDP in 2019, up from $5.8 trillion at the end of 2008.

    US dollar denominated credit to non-banks outside the US (USD Trn)

    Source: Bank of International Settlements

    Majority of this new debt was raised by corporates and currency fluctuation risk was hedged by rolling-over short-term FX swaps. Interest payments on this new debt had to be paid in dollar, which generally in normal circumstances secured by the cash flows received from exports. During the coronavirus outbreak, however, as international trade collapsed, commodity prices tanked, and short-term dollar funding dried up with lenders turning risk-averse, funding and hedging costs increased substantially. Interest rates on cross-currency basis swaps, which track the premium paid for exchanging currencies for dollars, turned significantly negative in mid-March. Speculation of a global dollar shortage triggered panic buying and pushed the dollar higher.

    Emerging market countries that depend largely on export revenue were most affected. So far this year the South African rand, the Brazilian real and the Mexican peso have lost more than 20% of their value against the dollar. According to the IMF, emerging markets will need at least $2.5 trillion in financial resources to get through the COVID-19 pandemic.

    Currencies against the US dollar (YTD change)

    Source: Bloomberg

    How have measures announced by the Fed affected demand for the dollar?
    The Fed has taken an aggressive stance toward tackling the crisis. It cut the target federal funds rate to zero for the first time ever and committed to purchase an unlimited amount of US Treasuries, mortgage-backed securities, municipal bonds and other assets. The Federal Reserve Board also reduced the reserve requirement ratio to zero percent.

    After injecting more than $2 trillion to boost liquidity and ease funding pressures, the Fed’s balance sheet has now surpassed $6.6 trillion – the highest ever– from $4.29 trillion in the first week of March.

    Fed Balance Sheet (USD Trn)

    Source: Federal Reserve

    The Fed acted like the central banker to much of the world and introduced a series of initiatives to support the supply of dollars in the international market:

    • It established swap lines with 14 central banks around the world: Reserve Bank of Australia, Banco Central do Brasil, Bank of Canada, Danmarks Nationalbank, Bank of England, the European Central Bank, Bank of Japan, Bank of Korea, Banco de Mexico, Reserve Bank of New Zealand, Norges Bank, Monetary Authority of Singapore, Sveriges Riksbank, and Swiss National Bank.
    • On March 31, it announced a temporary repurchase agreement facility for foreign and international monetary authorities. This enabled central banks to temporarily exchange their US Treasury securities held with the Fed for US dollars.

    Most central banks have tapped the swap lines facility. The dollars borrowed from the Fed increased to more than $400 billion by the third week of April from less than $60 million in the first half of March. These arrangements provided some respite from the dollar shortage and reduced the strain on financial markets in the short term. It also restricted the dollar appreciation, as foreign central banks have been selling domestic currency to meet a rush for US dollars.

    Will the US dollar shortage end soon?
    The COVID-19 pandemic has reinforced the dollar’s dominance in the global economy for now and the foreseeable future. The promptness with which the Fed stepped in will strengthen the dollar’s position as an international reserve currency. The ongoing crisis has also proven that there is no acceptable alternative to the current system and the high dependence on the dollar would continue.

    The severe shortage of dollars may only worsen in the coming years. Countries with strong external balance sheets, ample foreign exchange reserve and secure supply of dollars through swap lines can weather the storm. However, amid weak global demand, outflow of capital and depreciation of the local currency, companies and governments in emerging markets that need to access international bond markets to refinance foreign-currency debt may face significant challenges. Some of these countries do not have the required dollar liquidity to repay debt. The recent oil supply glut and substantial decline in oil prices would exacerbate the shortage of dollars globally, particularly for oil exporting nations that normally rely on global trade to service their USD-denominated debt.

    Persistent tightening in financing conditions in the international financing market is likely to spill over to domestic financing markets. Monetary and fiscal measures taken by emerging market countries, such as cutting the interest rate and providing fiscal stimulus to mitigate the impact on the economy, would weaken their currencies. Investors are increasingly wary of investing in these economies. A further flight to the dollar will only cause more damage to the local currencies of these markets.

    While the US Federal Reserve’s prompt and swift actions have curtained the panic buying of dollars in the short term, the central bank understands that shortage of dollars is a structural problem. Given the massive outstanding onshore and offshore dollar-denominated debt, expected wave of corporate defaults and higher volatility in financial markets, the dollar will continue to be the currency of choice for market participants—hence, its shortage will continue in the foreseeable future.


  52. Gaming: A Long-Term Investment Play?

    More than a third of the global population is now confined to homes, compelled to follow social distancing

      to read | words

    More than a third of the global population is now confined to homes, compelled to follow social distancing to limit the spread of the deadly coronavirus. The unprecedented scale of the pandemic has, however, blessed the gaming industry, which is buzzing with a sudden surge in sales of video games and gaming consoles as people seek ways to deal with the lockdown. The ‘new normal’ is here to stay for a long time and would definitely benefit the gaming industry, making it a profitable investment in the long term.

    Video game sales in some countries boomed (over 200%) during the first week of lockdown in March 2020. Stocks associated with this industry – those of gaming companies to GPU chipmakers – have rebounded strongly due to this market mayhem. Stocks of companies like Nintendo and Nvidia recovered by more than 40% from their lows in March 2020.

    Lockdown favors gaming industry
    Countries worldwide are going through difficult times due to the COVID-19 pandemic. As the outbreak continues to wreak havoc, severely affected countries have directed citizens to adhere to various forms of lockdown in order to maintain social distancing. Some countries have taken a drastic, but inevitable, step and ordered a complete lockdown, thus forcing people to remain indoors.

    The global lockdown has brought to a standstill economic activities; several business and industries have been badly hit. Ironically, the lockdown has brought advantage for the gaming industry as video games and gaming consoles fly off the shelves, figuratively.

    Due to the quarantine situation everywhere, citizens are locked indoors, which increases the consumption of media (especially streaming content) and video gaming as means of entertainment. As per an article by Gamesindustry.biz on the recent data from Games Sales Data (GSD), sales of consoles and games have steeply risen during the lockdown phase across countries.

    In countries that entered lockdown in March 2020, sales of digital games have skyrocketed. Italy, which entered lockdown the earliest (on March 9), saw a 175% week-on-week surge in digital game sales in the first week. Spain entered lockdown on March 14 and saw digital downloads shoot up by 143% during the week; France, which entered lockdown on March 17, followed suit, seeing a spike of more than 180% during the March 16–22 week.

    Countries that implemented a partial lockdown in March also experienced an increase in digital game sales. The UK saw digital game sales rise by 67% during March 16–22, followed by Germany, which saw game downloads increase by 60%, and Australia with 27%. The overall digital game market surged by 53% week-on-week.

    Exhibit 1: Surge in video game sales

    Note: Data for first lockdown week in March and growth represented as week-on-week
    Source: Gamesindustry.biz – an article published on Gamesindustry.biz

    Surprisingly, physical game sales during the period also went up, especially in countries implementing social distancing and entering a partial lockdown state. In Australia, physical game sales surged by 279% week-on-week. The UK witnessed similar numbers, with physical sales rising 218%, while France saw a 70% increase in such sales. Italy and Spain, the countries most affected by the outbreak and in complete lockdown, saw physical sales fall by 9% and 5%, respectively.

    Gaming stocks buzz with strong recovery
    As sales of video games go off the charts due to the lockdown, gaming companies are clearly direct beneficiaries here. While the pandemic caused major indices like the S&P 500 to fall sharply, stocks of gaming companies not only recovered, but also rose by 2–25% YTD. Stocks of gaming companies, such as Electronic Arts (EA), Nintendo (NTDOY), Activision Blizzard (ATVI), Take-Two Interactive (TTWO), Ubisoft Entertainment (UBSFY), and Zynga (ZNGA), recovered fairly quickly from the panic selling mode.

    Exhibit 2: Performance of gaming stocks

    Note: Rebased at 100 (Performance from 2nd Jan 2020 to 17th April 2020)
    Source: Yahoo Finance

    Gaming stocks recovered fast from their lows in mid-March. Nintendo recovered 44% from its lowest point registered in the third week of March; Electronic Arts and Zynga followed suit, going up by 32% each. The S&P 500 recovered by 28% from its lowest point on March 23. Considering the returns from January to now, these gaming stocks have registered positive returns, while the S&P 500 is down by 12%. Zynga is up by 26%, followed by Activision Blizzard (15%), Ubisoft (12%), and Nintendo (11%).

    Chipmakers also sail well in current scenario
    In line with digital game sales, those of consoles are also on an upward trend. As per an article by Gamesindustry.biz, Australia experienced the highest increase in console sales (up 286% week-on-week), followed by the UK (up 250%), in the first week of lockdown. European nations followed suit, experiencing considerable uptrend during the period.

    Exhibit 3: Surge in gaming console sales

    Note: Growth represented as week-on-week
    Source: Gamesindustry.biz – an article published on Gamesindustry.biz

    Chipmakers are experiencing a unique demand scenario in the current situation, which is unlike a traditional surge in demand. The global lockdown is clearly pushing up the demand for memory and graphics chips from PC manufacturers, data-center operators as well as gaming console manufacturers. Microsoft and Sony hinted at releasing their next-generation gaming consoles, which affected console sales at the start of the year as gamers waited for the latest products. However, the anticipated releases did not materialize as the lockdown hit production worldwide in March. The situation forced people to chase down consoles currently available on the market, such as Playstation 4, Ninentendo Switch, and Xbox One.

    GPU vendors such as NVIDIA (NVDA), Advanced Micro Devices, Inc. (AMD), and Intel Corp (INTC) are beneficiaries here; their stock performances hint at strong recovery during the current market mayhem.

    Exhibit 4: Performance of key GPU vendors

    Source: Yahoo Finance

    Nvidia, with its continued dominance as the global GPU vendor, led the rally with a 49% recovery from its lowest point in the third week of March, followed by AMD with a 46% increase, and Intel with 35%. Considering the returns from January until date, Nvidia’s stock has displayed positive returns with a 22% increase, followed by AMD (up 15%); meanwhile, the S&P 500 index is down 12% during the period. This clearly indicates that the pandemic has not affected these companies at all, but has in fact benefitted the industry, with more new gamers entering the field nearly every day.

    The ‘new normal’ phase seems promising for gaming
    As the world continues to battle the rise in coronavirus cases, lockdowns and social distancing appear to be the only effective means to slow the spread of the virus. Quarantine situations across countries will continue to fuel the demand for video games as more employees and students remain housebound or work or learn from the confines of their home in the ‘new normal’ phase. If employers consider ‘work from home’ a viable alternative for future operations as well (also from a cost-saving perspective), the new normal may become our way of life.

    In continuation to this consideration, many would definitely turn to GPU-powered laptops and desktops to be future-ready. An increase in console sales suggests the entry of many newcomers into the gaming world, which would further spur the demand for video games. This would certainly help gaming companies, GPU vendors, chipmakers, and also the semiconductor industry, in the long run.

    The pandemic, which is not yet under control, has changed the world because of its scale, especially in western economies. Instances of a resurgence in cases in Asian economies – such as China, Japan, and Singapore, which had earlier seen a fall in cases – are generating concerns about a second wave breaking out, once these economies reopen at the end of the current lockdown. As such, social distancing and more time spent indoors may become the norm for a long time (possibly stretching into the next year) as against the earlier expectations of a quick end to the current situation. Under these changing circumstances, sectors such as gaming would continue to benefit from the growth in demand.


  53. Will COVID-19 be a game changer for retail fashion?

    Stephen Covey once said, "If there's one thing that's uncertain in business, it's uncertainty." This holds true especially

      to read | words

    Stephen Covey once said, "If there's one thing that's uncertain in business, it's uncertainty." This holds true especially in current times, given the scale of the COVID-19 crisis and uncertainty surrounding its impact on the society and economy. Despite the challenges posed by epidemics, they often pave the way for innovation and bigger opportunities. This article explores how fashion retailers are coping with the crisis and looking at alternative avenues.

    The World Health Organization reported that as of April 22, 2020, there were 2,475,723 COVID-19 cases globally, while deaths caused by the virus totaled 169,151. Businesses across sectors have been hit. While some sectors may probably bounce back gradually, for others, it could be a prolonged fight.

    Impact on fashion retailers – Some insights

    • Reduced consumer spending or quarantined consumption
      As expenditure on fashion is discretionary, it is particularly vulnerable during times when finances are tight. Amid the uncertainty in job markets and liquidity crunch, consumers are treading cautiously, spending only on essential goods. Cutting down on leisure shopping or travel, adversely affects these sectors. While these expenses may currently be deferred due to lockdowns, the trend may continue even after the lockdowns are lifted as people would become more mindful of their spending habits.

      The Chinese, for example, have been the major buyers in the luxury and fashion market for the past 10 years. According to a report by Bain & Company, they accounted for about 33% of all luxury purchases in 2018. Pandemic-induced restrictions have affected their travel and, in the near future too, as long as the fear persists in the minds of people, travel to fashion hubs such as Paris and New York would be limited. Repercussions due to change in consumer behavior may outlast the pandemic itself.

      Fashion, one of the major industries in the world with $2.5 trillion annual revenues globally prior to the pandemic, is among the worst hit. As per a McKinsey & Company report, the global fashion industry’s (apparel and footwear sectors) revenue would fall 27–30% YoY in 2020. The industry may return to growth, albeit low at 2–4%, in 2021. Revenue in the global personal luxury goods industry (including luxury fashion, accessories and watches; fine jewelry; and high-end beauty products) could decrease 35–39% YoY in 2020, but is expected to grow 1–4% in 2021. The bad news is if stores remain closed for another two months, 80% of publicly listed fashion companies in Europe and North America would be headed toward financial distress.

    • Sell-off haunting fashion stocks
      Stock markets globally have declined significantly in the past few weeks as the disease outbreak reached alarming proportions. Going by a McKinsey & Company report, the market capitalization of apparel, fashion and luxury companies decreased nearly 40% on average from the beginning of January to March 24, 2020. The decline was far steeper than that in the global stock market.

      Fashion stocks in the US stand battered. On year-to-date (YTD) basis, as of April 22, 2020, returns turned negative for Capri Holdings, which owns brands such as Michael Kors, Versace and Jimmy Choo (down 70.9%); Macy’s Inc (down 71.6%); Nordstrom Inc. (down 60.1%) and Tapestry Inc (down 50.3%). It is equally bad for European fashion stocks, with the likes of Salvatore Ferragamo down 41.6% YTD, LVMH falling 14.7% YTD, and Burberry Group Plc declining 38.8% YTD. Nation-wide lockdowns and their impact on corporate profits are being factored into the stock prices.

      With COVID-19 cases rising worldwide, the global macroeconomic outlook is extremely bleak. On April 14, 2020, the IMF projected a 3% decline in world GDP for 2020 vis-à-vis the 2.9% growth in 2019. The US GDP is estimated to contract by 5.9% in 2020, while that for the Euro Area is expected to decline 7.5%, led by Italy (likely to record the highest decline at 9.1%) and Spain (projected to fall 8.0%).

    • Retail store closures
      Social distancing has led to the closure of several outlets. Also, demand for new clothes has decreased with people staying home and refraining from buying anything that is not essential. Bangladesh is the biggest garment exporter in the world, after China. The Bangladesh Garment Manufacturers and Exporters Association (BGMEA), one of the largest trade associations in the country, says that fashion companies have either cancelled or put on hold orders placed with garment factories in Bangladesh. The combined value of these orders is at least $3.0 billion, almost equal to a full month of exports, based on previous data from BGMEA. Some companies that have cancelled orders are Primark, C&A, Inditex (Zara), Tesco, Kohl’s, and Walmart.

      Amid these circumstances, major retailers and brands, such as Macy’s, H&M, Nordstrom, Chanel, Saks Fifth Avenue, Sephora, Ralph Lauren, Apple, Nike, Walmart, and Urban Outfitters, have temporarily closed their stores in the US.

      Several luxury chains have been pushed to the brink of bankruptcy, such as Dallas-based Neiman Marcus due to its inability to repay debt on account for insufficient earnings. JC Penney and Nordstrom may also follow suit if store closures extend into summer.

      The chart below represents the percentage of fashion players (apparel and luxury companies in the US, Canada and Europe) likely to face financial distress given various lockdown durations.

      Source: McKinsey & Company Strategy and Corporate Performance Analytics
      Note: Based on McKinsey’s sample data and calculations.

    • Online shopping takes a hit
      For many shoppers, experience at stores takes precedence over buying online. This is especially true for luxury shoppers as the price of the product is high and, therefore, ‘touching and feeling’ it is more reassuring before making a purchase than just viewing online. Even if these consumers turn to online shopping compelled by quarantine measures, delivery of products or raw materials has already been affected due to disruption in supply chain following the coronavirus outbreak. Moreover, China and Italy, both occupying very crucial positions in the global fashion industry, have been majorly hit by the pandemic. According to the World Trade Organization (WTO), China accounts for over 37% of the world's textile exports, up 27% from 2000. Italy, on the other hand, is a global center for luxury manufacturing.

      Another factor that has prevented people from ordering online is the need to maintain hygiene, in line with the WHO’s guidelines, to reduce the risk of infection. Ordered packages could expose them to the virus.

    • Going virtual

      "In order to be irreplaceable, one must always be different." —Coco Chanel

      Unforeseen problems often demand innovative solutions. The pandemic can be seen as an opportunity to redefine strategies and work toward creating a sustainable business model in the digital age. One of these could be the way events are planned. While several major events are being cancelled due to COVID-19, some are going virtual. For example, the New York Bridal Fashion Week is being held virtually with the help of webinars, Zoom, and other online platforms.

      Another novel solution for fashion players is digitalization to ensure efficiency and avoid logistics-related issues. Companies like Unmade are helping clients make their supply chains more supple or go completely digital.

    • Branding and social causes
      Fashion houses have come up with innovative ways to donate in this time of crisis. Louis Vuitton, part of LVMH (the world’s biggest luxury goods group), is diverting five of its French workshops for making masks for frontline health workers. Dior, also owned by LVMH, is producing masks for hospital staff. The company also ordered its perfumeries to shift production to hydroalcoholic gel hand sanitizer for free distribution to French hospitals. Similar initiatives have been taken by Prada and Kering (owner of Balenciaga and Saint Laurent).

      Companies are constantly on the lookout for new ways to connect with consumers. Espousing a social cause in such a time of need is indeed noble and will help them strike the right chord with customers.

      The pandemic has put to test the business models and resilience of companies. While it is difficult to predict the future for the fashion industry, it will be interesting to see how businesses adapt and emerge from probably the most challenging economic environment since the Great Depression of 1930.


  54. COVID-19: Impact on US M&A Market

    The ongoing health crisis, coupled with the resultant economic slowdown, has severely impacted the US M&A market.

      to read | words

    The ongoing health crisis, coupled with the resultant economic slowdown, has severely impacted the US M&A market. Numerous deals were either put on hold or cancelled in the last one month. Though in the medium term the recovery of the market would be sluggish, going by past economic downturns, this could be the right time to sign M&A deals. During downturns, quality companies are available at 13–21% valuation multiple discount, while previous cases show that deals carried out during this period generated almost 10% higher returns for shareholders.

    M&A activity directly correlated to economic growth and decline
    Outlook for the US M&A market for 2020 was positive, with both M&A and capital raising activities expected to increase. However, the coronavirus outbreak, followed by the economic downturn, has put a brake on M&A activity in the US—transaction volumes in 1Q plunged 32% over the last quarter and 35% compared to the previous year.

    Amid the current turmoil, while companies are focusing, on the one hand, on tackling the global health emergency, they are also working on plans regarding how to proceed once the COVID-19 crisis is over. According to a recent KPMG survey of ~2,900 C-suite executives globally, ~56% intend to scout for inorganic growth opportunities over the next 12 months.

    US M&A cycles and economic recessions

    Source: S&P Capital IQ, Aranca Research; Note: As of 13 April 2020

    Channel checks conducted by Aranca suggest the US M&A market would be bearish in the near term, given the significant surge in COVID-19 cases. Nonetheless, once the pandemic is contained and the situation normalizes, M&A activity would pick up in the medium to long term, considering the anticipated pent-up demand in the second part of the year. However, the market is also treading cautiously, fearing the health crisis may worsen; if this happens, the volume of activity could decrease across the board.

    Median M&A valuation multiples tend to fall during downturns
    Over the last couple of decades, M&A valuation multiples have generally increased, but median multiples have declined significantly during downturns. During the 2008 financial crisis, the median ratio of M&A deal value to revenue declined 13% on average, while the ratio of M&A deal value to EBITDA fell 21% compared to previous years. The decline in M&A multiples during this period provided an attractive opportunity to acquire high quality assets at subdued valuations that would drive growth amid recovery in market.

    US M&A valuation multiples and economic recessions

    Source: S&P Capital IQ, Aranca Research; Note: As of 13 April 2020

    We believe as COVID-19 spreads and the economic slowdown continues globally, top companies across sectors may face financial difficulties and M&A valuation multiples will decline sharply. This would provide an attractive acquisition opportunity for companies that have built a healthy balance sheet (leveraging the previous economic boom) and created long-term value.

    M&A deals carried out during downturns generate higher returns for shareholders
    As seen so far, M&A deals signed during economic slowdowns have fared better than those entered into during stable growth phase. An analysis by BCG reveals that companies that made acquisitions during downturns generated 9.6% incremental returns for shareholders vis-à-vis deals executed when the economy was stronger.

    Acquisitions made during the downturn fare better in the long term

    Source: BCG Analysis

    The incremental outperformance of these companies is attributed to acquiring quality business at lower valuation multiples and positioning the business better amid economic recovery. We believe investors that are ready to take the risk will fare better once recovery sets in the long term.


  55. Top sectors to watch out for as life changes due to Covid-19

    The COVID-19 pandemic has created ripples in the already volatile global stock market. Several major global indexes fell

      to read | words

    The COVID-19 pandemic has created ripples in the already volatile global stock market. Several major global indexes fell more than 30% from their recent highs within a couple of months, and then recovered marginally. Companies associated with the travel and tourism sector witnessed a drastic drop (40–50%) in share prices at an accelerating pace. A few other sectors also bore the brunt of this steep decline. Ironically, there are some sectors that stand to benefit from this scenario and present attractive investment opportunities.

    COVID-19 has now spread to more than 180 countries across six continents, with over 2.5mn cases and more than 175,000 deaths worldwide as of April 21, 2020. To contain the spread, several nations have gone into lockdown in order to maximize social distancing. Stock markets also felt the impact of the coronavirus, as major stock indexes fell more than 30% from their highs. For example, the DJIA Index entered bear territory in just 20 trading sessions, the fastest slide in the history of the US stock market. Even though the long-term impact on stock markets is difficult to determine as of now, it does present an opportunity to invest in certain sectors that could benefit from the current scenario.

    While most sectors have been adversely affected by the pandemic, a few sectors might be able to cash in on this opportunity and generate sustainable returns.


    Specific technology companies: Most organizations have adopted the WFH policy to promote social distancing. This has led to the need for products facilitating connectivity and aiding employees to access office files securely. Some of the categories of technology companies include:


    The current phase of WFH due to lockdown seems temporary and could end in a few months depending on how quickly the situation is brought under control. However, some organizations have also realized that work can be continued even while working remotely. Hence, they could create a pool of emergency workforce that works in a simulated situation by utilizing the current tools and approaches. A few of the sectors benefiting from this back-up plan of organizations could continue to be in prominence even after the pandemic subsides. Investing in these sectors would enable investors to generate sustainable long-term returns.


  56. Surge in GCC sovereign bond issuances at attractive yields: Buyers underpricing risk?

    Multibillion-dollar bond issuances in April 2020 by three Gulf Cooperation Council (GCC) countries – Qatar, Abu Dhabi and Saudi Arabia – hav

      to read | words

    Multibillion-dollar bond issuances in April 2020 by three Gulf Cooperation Council (GCC) countries – Qatar, Abu Dhabi and Saudi Arabia – have galvanized the fixed income market, especially the emerging economies segment. The attractive yields offered prompted fixed income investors to submit bids exceeding the issue size. However, the region is reeling under the impact of the slump in oil market, besides the economic fallout of COVID-19-induced lockdowns. Therefore, the question arises would the yields adequately compensate for the risks.

    Qatar, Abu Dhabi and Saudi Arabia raising billions of dollars in sovereign debt
    So far in April 2020, three Gulf Cooperation Council (GCC) members – Qatar, Abu Dhabi (part of the UAE) and Saudi Arabia – have raised or are in the process of raising around USD 25 bn of sovereign debt. First, Qatar launched a USD 10 bn Eurobond in three tranches of 5, 10 and 30 years that attracted USD 25 bn, or 2.5 times the issue size. Thereafter, Abu Dhabi launched a USD 7 bn bond, also in three tranches of 5, 10 and 30 years, attracting bids nearly 3.5 times the issue size. Recently, Saudi Arabia too launched an issue, worth USD 7–10 bn, in three tranches of 5.5 years, 10.5 years and 40 years, its first longest-tenure bond. Lured by the yields, fixed income investors are flocking to these issuances—the Saudi Arabian bond has attracted bids nearly 6 times the issue price, as per media reports.

    Exhibit 1: Details of debt issuance by GCC countries in April 2020

    Country

    Issue Size (USD bn)

    Tranches

    Bids (USD bn)

    Bid to issue (x)

    Qatar

    10

    Three tranches (5-year, 10-year, 30-year)

    25

    2.5

    Abu Dhabi

    7

    Three tranches (5-year, 10-year, 30-year)

    25

    3.5

    Saudi Arabia

    7 to 10

    Three tranches (5 and ½-year, 10 and ½-year, and 40-year)

    42

    6

    Source: Aranca Research

    Spreads attracting fixed income investors
    The spreads offered for these issuances range between 200 and 325 basis points (bps) over benchmark US treasury instruments of similar tenures; no doubt, they are highly attractive for fixed income investors. Central banks across the globe have cut rates, and central banks in major developed markets, such as the US Fed, have reduced rates to zero. Yield curves of major sovereigns are either close to zero or near negative for most part. As such, investors in sovereign bonds were faced with the challenge of finding the investment opportunities to deploy funds which would give them higher yields without compromising the portfolio’s risk profile. The investment grade sovereign credit issuances in these countries, with the stated spreads and yields, could not have come at a more opportune moment. For fixed income investors, the offers are ‘irresistible’, going by their comments in media. Moreover, rating agencies affirming the investment grade credit ratings for these countries has provided further reassurance in the face of the three main adversities: economic fallout of COVID-19 on the region, decline in oil market (compared to the start of the year) and uncertainty regarding demand.

    Exhibit 2: Spreads and yields offered tenure-wise for each issuance

    Country

    Credit Rating (S&P)

    Tranche

    Yields

    Qatar

    AA-

    5 year
    10 year
    30 year

    300bp over US 5 yr or 3.4% equivalent
    305bp over US 10 yr or 3.8% equivalent
    4.4%

    Abu Dhabi

    AA

    5 year
    10 year
    30 year

    220bp over US 5 yr or 2.67% equivalent
    240bp over US 10 yr or 3.17% equivalent
    4.1%

    Saudi Arabia*

    A-

    5 and ½ year
    10 and ½ year
    40 year

    315bp over US 5 yr or 3.49% equivalent
    325bp over US 10 yr or 3.99% equivalent
    5.15%

    Source: Aranca Research; Note: *- Issue still in market, final spreads and yields may change

    Economic impact of COVID-19 in GCC region
    The GCC region’s economy, like the rest of the global economy, is negatively affected by pandemic-related restrictions on movement and activities, ranging from partial curfews to 24-hour lockdowns. The region, home to millions of expats, is also witnessing a rise in cases among undocumented immigrants, who are reluctant to come forth for treatment, despite assurances from the government that they would not be required to disclose their identity. The epidemic has also reached the high corridors of power, with many members of the Saudi royal family being diagnosed with the infection. The more the virus spreads, greater the delay in easing restrictions and resumption of economic activities in the region. The IMF, in its latest economic outlook report published in April 2020, has slashed the 2020 GDP growth estimate for the Middle East region to -2.8% from +2.8% (previous update in January 2020). GDP of Saudi Arabia, the biggest economy in the region, is expected to contract 2.3% in 2020 vis-à-vis the earlier estimate of a marginal 0.3% contraction (as per previous update in January 2020).

    Dependence on oil and volatility aggravating the situation

    For the oil and gas producing countries in the GCC region, volatility in oil market is an additional concern, besides the negative economic impact of COVID-19-induced lockdowns. The region has historically been a major producer and exporter of oil and related products that contribute significantly to government revenues and have a strong bearing on its economic growth. The oil sector accounts for 30–50% of the GDP of major exporters, which indicates the close link between economic growth and developments in the oil market. Volatility in oil markets, therefore, does not bode well for these economies and would adversely affect exports, government revenues and fiscal balances.

    Oil prices were under pressure in 2019 due to oversupply in the market amid slow growth globally. However, an agreement was reached between OPEC and select non-OPEC producers (such as Russia), together known as the OPEC+ group, to voluntarily implement production cuts of up to 2 million barrels of oil per day (roughly 2% of daily demand) in order to reduce supply and rebalance the market supported prices partly. However, in March 2020, the agreement fell apart as lead producers Saudi Arabia and Russia sparred publicly. With the deal ending, production increased immediately and producers offered price discounts in a race to gain market share. Consequently, oil prices nosedived, falling over 50% in March 2020.

    As the decline in oil price would have severely affected the US shale oil industry (not party to the OPEC+ agreement), US President Trump took the lead in the effort to bring the OPEC+ group back to the negotiation table. In April, after marathon discussions, the group agreed to cut up to 10 million barrels of oil per day (or roughly 10% of production) among various producers from May 2020. However, the discussions were not smooth, as Mexico did not agree to its share of production cut, requiring another intervention from the US. Considering the level of commotion and lack of clarity regarding production cuts, the oil market is sanguine about actual implementation. Furthermore, the latest report from the International Energy Agency (IEA) states that demand for oil is expected to fall by 29 million barrels of oil per day in April 2020 (or roughly one-third of average demand in 2019). As such, the production cuts announced may not be enough to rebalance the market. Oil prices are reflecting the grim reality, by toppling again.

    Exhibit 3: Brent crude prices (USD/barrel)

    Source: Refinitiv

    Bond markets looking to hedge against falling oil prices by way of higher CDS spreads
    As economic growth prospects for GCC countries weaken, as COVID-19 spreads in the region and oil prices plunge, bond markets have reacted decisively, reflected in weakening yields on benchmark sovereign bonds as well as rise in credit default spreads (CDS), a proxy for cost of insurance against sovereign default. As the following exhibit depicts, CDS rose sharply by 200% to 400% for various GCC countries, and that too in a span of only 3 months, indicating the bond markets’ view of sharp rise in default risk for these sovereigns. In the first fortnight of April 2020, following the news of a new agreement to cut production by up to 10 million barrels per day of oil, CDS have narrowed but not substantially.

    Exhibit 4: CDS spreads (over US 10-year yields) for GCC countries over time

    Source: Aranca Research; Refinitiv; Note: UAE represented by Dubai

    Yields offered on recent issuances compensating for growing risks?
    Yields offered on recent issuances are undoubtedly quite attractive compared to prevailing yields for existing instruments. Comparing 10-year sovereign yields, Qatar’s new issuance yield of around 3.8% was higher than the then prevailing yield of around 3.6–3.7%. Abu Dhabi’s issuance yield, at around 3.2%, compares favorably to the prevailing 3% yield. Saudi Arabia’s new issuance initial yield of 3.9% would appear very attractive vis-à-vis the current 3.2% yield, and the final issue yield is expected to be tighter but above market yields. Moreover, Saudi Arabia has launched a 40-year bond, which is the longest tenure for any regional sovereign bond. The size of bids has been in multiples of the issue size, underscoring the attractiveness of issuances even during the current global turmoil. The market appears to have given a thumbs up, despite the risks, such as:

    1. Resurgence of COVID-19: Currently, capital markets are optimistic that the curve of infections would slope downward in developed economies, such as Europe and the US, which reported the highest casualties. Unprecedented measures such as extended shutdowns are now being replaced by plans to resume operations in phases in certain sectors of the economy. However, the evolving situation in countries such as China and South Korea suggests that we are yet to completely understand the nature of the virus. Asymptomatic transmissions are rising, in addition to new cases discovered following the resumption of international travel, which led China to seal its borders with Russia. The World Health Organization has also alerted governments against reopening economies before building adequate testing and healthcare capacity in place. If there is a resurgence in cases after the relaxation of shutdown, governments will be compelled to reimpose restrictions. If this happens, it will pave the way for ‘risk-on’ trades in capital markets that would lead to a decline in yields.
    2. Unprecedented uncertainty in oil market: Uncertainty surrounding demand for oil, crucial to GCC economies, is high (both immediate and long-term). The historical production cut of 10 million barrels per day (mbpd) agreed upon following intense negotiations is contingent on joint compliance by the parties to the deal. In the earlier round of cuts, Russia refrained from complying fully. This time, Mexico has raised objections, saying instead of complying with the 400,000-bpd production cut, it will restrict it to just 100,000 bpd. As per media reports, US President Trump has offered a solution wherein the US would reduce its production, absorbing Mexico’s share, for which the latter could ‘compensate’ later; however, the US cannot openly agree to cuts as this would be in violation of anti-trust regulations (instead, it believes market forces – demand and supply – would naturally lead the shale oil industry to reduce production). As such, the agreement appears to have been put together in a hurry, reflecting a desperation to indicate to the oil market that some action is being taken to address concerns. Besides, there is Saudi Arabia holding the Democles’ sword of offering price discounts in its bid to gain market share from Russia. Finally, demand may decline further as economic shutdowns dwarf the benefits of production cuts; this would mean fall in oil exports of GCC producers, in addition to the decline in oil price. In such a scenario, yields offered by issuers may not adequately offset risks.

    Fixed income markets, keeping the dynamics in mind, have still voted in favor of issuers, going aggressively for bond issuances. Market participants may be taking comfort from the large forex reserves available with the issuers, relatively low debt-to-GDP ratios (compared to developed markets) as well as investment grade ratings affirmed by rating agencies recently. However, considering the unprecedented situation governments across the world are grappling with, the path to recovery is uncertain and with no precedent. Bond markets are quick in reacting to the spread of COVID-19 and expected impact on economies, evident from the rapid widening of CDS. Investors in recent issuances would do well to bear the risks in mind, especially if the rest of GCC countries, with weaker ratings, encouraged by the success of Qatar, Abu Dhabi and Saudi Arabia decide to follow suit.


  57. Indian Banking Industry: Governance Reforms Imperative to Regain Confidence of Stakeholder

    Yes Bank is among the latest to be added to the list of Indian banks that have been

      to read | words

    Yes Bank is among the latest to be added to the list of Indian banks that have been in trouble recently. The string of bank failures has raised questions about the industry’s otherwise strong regulatory framework. Is there a way to prevent more such episodes?

    Yes Bank, India’s fifth largest bank, is currently in crisis due to corporate governance issues. Problems at Yes Bank surfaced a few years earlier, when it was forced by the RBI to disclose its nonperforming loans (NPLs) on grounds of discrepancy in reporting—totaled approximately $630 million vis-à-vis $113 million reported for the financial year ended March 2016. The gap widened to almost $1 billion by 2017. NPLs included loans disbursed to some of its biggest customers such as Anil Ambani’s now bankrupt Reliance Communications. The bank also gave huge loans against intangible collateral that was tough to value or seize, such as virtually unenforceable “personal guarantees” by well-known businessmen. Finally, it came to light that for the quarter ended December 2019, Yes Bank had reported a loss of INR18,564 crores with a gross NPL of 18.87%. It reported a capital adequacy ratio of 4.2% at the end of the September quarter.

    The RBI imposed a freeze on withdrawals, triggering panic among the bank’s customers and affecting business entities with corporate accounts. The uncertainty and speculation surrounding Yes Bank’s fate for the last few months eased to an extent after India’s largest bank, the government-owned State Bank of India (SBI), stepped in to rescue it; SBI will bail the bank out on certain conditions. As efforts are being made to revive the bank, asset prices have fallen, affecting equity investors, while AT1 bonds have taken a severe a hit (INR8,415 crores wiped off), which has impacted debt investors significantly. The arrest of its founder Rana Kapoor by the Enforcement Directorate (ED) under the Prevention of Money Laundering Act (PMLA) in March 2020 was a low point in the bank’s history.

    Indian Banking Sector Disasters
    Yes Bank is not the only example. More Indian banks have landed in trouble lately, leading to losses for their depositors, some of whom had trusted the banks with their life savings. Bad loans, NPAs and fraudulent activities are some of the reasons cited for the largescale disasters.

    In October 2019, Punjab and Maharashtra Co-operative (PMC) Bank was forced to down its shutters. The reason behind it was that two-thirds of loans were allegedly given to a real estate company, HDIL, that went bankrupt. The bank had transferred 70% of the total credit facilities to HDIL and its associated companies. Besides, about 21,049 bank accounts had been opened under bogus names to conceal 44 loan accounts. The bank catered to a large population but was not actively supervised by the RBI. The issues came to light when a whistleblower from the bank alerted the regulator of fraudulent activities. The RBI will now take a call on whether to liquidate the bank, revive it or merge it with another bank.

    Before this, it was the Punjab National Bank fraud case. This INR10,000-crore scam revolved around fake Letters of Undertakings (LoUs). With the help of some PNB officials, certain tycoons in the jewelry industry used these instruments to source funds illegally and then went absconding.

    Apart from these prominent examples, there are many cases involving smaller banks. One of these is Mapusa Urban Cooperative Bank (MUCB), the oldest cooperative bank in Goa, whose license has been cancelled by the RBI. Sanctions were imposed on MUCB in 2015 after its capital adequacy ratio fell below the RBI-designated 9% threshold, and accumulated losses exceeded INR100 crores. The irony of the situation is that when MUCB hit rough weather in sustaining operations, it sought to merge with none other than PMC Bank, whose survival itself is at stake now.

    Why do banks fail?
    There are multiple reasons, such as:

    1. Absence of or poor corporate governance standards – It is essential for banks to adhere to corporate governance standards and maintain complete transparency in dealings. Being the custodians of savings of citizens, banks must follow proper protocols for governance.
    2. Concentration of risk – For PMC Bank, the main reason for downfall was disproportionate concentration of assets in one or few companies or sectors. Even in case of scheduled commercial banks, while technically lending is diversified, there have been cases of evergreening loans by lending to entities associated with company promoters, thus leading to circulation of funds without the asset actually earning money through normal operations.
    3. Weak regulatory control over cooperative banks – Disclosure requirements for cooperative banks are lower compared to those for scheduled commercial banks, while regulations are also comparatively less stringent. As a result, it is easy for discrepancies to creep in. Politicians usually seek board positions on these banks, looking to secure easy funding for personal gains.
    4. Inaccurate evaluation of risks in lending – A bank should be able to accurately evaluate projects from the perspective of feasibility and profitability, and accordingly lend money. Incorrect estimation of risk to return ratio can prove a costly mistake.
    5. Withholding disclosure of NPAs – Hiding or withholding disclosure of important items such as NPAs is like a ticking time bomb. Early disclosure of suspicious accounts can help banks to take corrective measures on time. However, in their bid to aggressively grow credit, banks at times ignore disclosure norms due to which risks increase.

    On their part, Indian banks have resisted political interference in lending and lobbied with the government to obtain more power to seize and liquidate assets of willful defaulters. Such borrowers used to take cover under India’s legal system and prolong the process of recovery, rendering it ineffective. The Insolvency and Bankruptcy Code gave banks the much-needed enforcement power and specific timelines for resolution of such cases. However, relaxation of certain terms and conditions under pressure from the industry and exemptions provided due to the current COVID-19 crisis are a huge setback to effective implementation of reforms.

    How to protect banks from failing
    Given the myriad reasons and mechanisms of failure, a one-stop solution is not possible. However, addressing the main causes of recent failures may soften the blow to an extent.

    1. Improving lending standards – Lending to commercially unviable projects must be discouraged. Political interference is a perennial obstacle to justified lending even in non-banking corporations. Hence, unless politicians stop interfering, it would be difficult to make lending foolproof.
    2. Strengthening audit committee – Both internal and external audit committees must have the authority to take strict actions to ensure banks operate in line with regulations.
    3. Effectively handling whistleblowing – Alarms raised by whistleblowers must be looked into by an independent audit committee to restrict interference and coercion by senior members who may be guilty.
    4. Conducting forensic audits periodically – Periodic forensic audits are important to check wrongdoings by a bank and its personnel. All financial transactions and decisions involving finance are analyzed to detect scope of fraud.
    5. Increasing regulatory control over cooperative banks – There is need for higher regulatory supervision of cooperative banks by the RBI, considering their rapidly increasing assets as well as depositor base. Currently, they are regulated and supervised by the Registrar of Cooperative Societies (RCS) at the state level or central level. The government has also proposed modification of the Banking Regulation Act in February 2020 to give RBI greater powers for supervision over cooperative banks. Hopefully, the bill will be passed by the Parliament soon.
    6. Improving composition of board of directors – The board is a part of all critical decisions and determines the overall direction for the bank. Having more independent directors and ensuring greater diversity at the board level can help in improving governance standards and, thereby, preventing frauds.
    7. Separating ownership and management – To establish accountability, ownership and control should be separated through mandates. After the Yes Bank fiasco, the RBI is actively asking banks to cap promoter shareholdings, but much more needs to be done in this regard.

    In a country like India, banking has not penetrated as much as it has in developed markets; moreover, several sections of the society (rural, lower strata in urban areas) remain unbanked. In such a scenario, banking crises further dent the confidence of the general population and slow the process of expansion of banking coverage. This has implications for general governance reforms such as Direct Benefit Transfer (DBT) or direct payment of subsidies and scholarships to beneficiary accounts.

    Amid decreasing confidence, people either hoard cash or look for alternative options. The main objective of banks is to ensure safety of personal wealth of individuals. If trust has waned, the banking industry, in coordination with the government and regulatory authority, must work toward regaining the confidence of citizens.


  58. Data sourcing: Key to decision-making

    Data sourcing is an essential step in developing robust data-backed strategies. Gleaning relevant and accurate information entails verifying

      to read | words

    Data sourcing is an essential step in developing robust data-backed strategies. Gleaning relevant and accurate information entails verifying the authenticity of data and its source. Skipping this could lead to inaccuracy in data compilation, which would affect analysis. Hence, companies must understand the importance of data sourcing and plan it accordingly.

    Technological advancements, advent of online businesses and penetration of internet across industries has led to the generation of massive data, which companies can use to derive important information and take strategic decisions.

    For this, data building is essential. It defines how data is collected, stored, transformed, circulated and effectively used. It outlines the process to store databases, file systems and the procedure to create structured plans. The process is based on effectively leveraging the correlation between data and business strategy. Information architecture entails converting data into useful facts that the business can apply efficiently.

    Companies have attempted to pursue highly consolidated, controlled approaches for data and information building. However, challenges pertaining to sourcing from authentic sources, accuracy and usefulness persist.

    Unfortunately, data sourcing is frequently ignored, especially by companies that do not have a data warehousing background. They are unaware of the importance of authenticity of source. Validity and quality of data is crucial for any data warehousing project. Hence, it is essential that once received, data is cleansed and verified. Quite a few companies skip this step as they are more concerned with data entry application and do not feel the need for improvement.

    Data sourcing helps in:

    • Keeping a track of quality of data, veracity of source and functionality
    • Checking performance, technicality and size

    Data sourcing deals with reviewing different sources of data, analyzing the information and ascertaining its relevance for any business. A ‘Go/No-Go’ decision needs to be taken after understanding the significance of the data for the business. Challenge arises when too many third-party sources are available in the market. It becomes difficult for a company to gather data from every source and establish its relevance. Selecting the right source and using its data in the best way is of utmost importance. Incorrect decisions due to faulty data can impact a company’s strategic and long-term plans negatively. Sourcing right data helps a firm to take correct decisions which fulfill its objectives and satisfy all stakeholders.

    Case Study
    The following example emphasizes the importance of data source verification.

    A private investment firm usually focuses on partnering with management teams to build leading companies. Investment firms seek companies with potential to grow either organically or via acquisitions. They usually target firms with focused management, and strong offerings and cash generation prospects.

    To make the right strategic decision, a private investment firm requires specifically curated information around performance of CEOs and their background. As this information is generally present on multiple channels, it is imperative to select only those that are authentic. For professional data, the websites are:

    • LinkedIn
    • Bloomberg
    • Capital IQ
    • Reuters

    Further online search is carried out to reconfirm and add details.


    It must be understood that important investment decisions will be based on this analysis, which, in turn, will depend on the data sourced.

    Once the relevant data is sourced from different websites, each data point needs to be reviewed for the respective CEO against the scoring criteria; thereafter, a rating is given. A private investment firm would generally like to work and invest in high performing CEOs. So, it is critical to have a robust evaluation mechanism before the final report is prepared.

    Conclusion:
    The source of data is crucial as the quality of information depends on it. Businesses depend on data in making strategic decisions that directly impact their plans, objectives and operations. Hence, accuracy of data cannot be compromised. In fact, data sourcing is the first step in data analysis on which the rest of the analysis is based. Therefore, it is imperative that the source is evaluated and verified before the process begins.


  59. Investment opportunities in distressed assets amidst Covid pandemic

    In the wake of the COVID-19 pandemic, nations are deploying various measures to limit causalities. The crude price

      to read | words

    In the wake of the COVID-19 pandemic, nations are deploying various measures to limit causalities. The crude price war between Russia and Saudi Arabia isn’t helping either. The negative impact of the outbreak is felt across sectors. The distressed debt industry will now go into an overdrive as businesses face shutdowns and unemployment rises. Which sectors get affected? How severe will be the impact? 2020 will be the crucial year…

    Narratives are changing in less than a year
    In September 2019, famous distressed debt investor and co-founder of Oaktree Capital Group Howard Marks said, “Investing in distress debt is a struggle today…. The economy is good, the capital markets are too generous. It is hard for a company to get into trouble”. His industry peers shared similar insights then. The Federal Reserve had lowered interest rates in its bid to offset adverse impact of the US-China trade war, equity markets had shrugged off a brief decline in August 2019, and yield pick-up on speculative grade corporate bonds had again slipped back to the lows seen after 2008. Distress was nowhere to be found.

    Fast-forward to today and the entire narrative has changed
    In just six months, Howard Marks is opining differently—he is pessimistic about the recovery of the US and global asset markets impacted by the pandemic. He predicts price markdowns, increased haircuts and a dearth of bailouts for some lenders. Junk bond spreads have more than tripled since September 2019 from 350bps to 1,100bps, with debt trading at distressed level reaching c. USD 1trn in the US alone. Price of distressed debt (bonds) has tumbled c. 40% in 2020 already.


    Marks further compares the current crisis to the global financial crisis of 2008 and mentions that this time round, it would be highly unlikely that government bailouts would be made available to non-bank-lenders and funds that have supplied leveraged securitizations. Aggravating the situation, there is further concern over the sharp decline in oil prices and the ongoing price war involving Saudi Arabia and Russia, which is expected to impact the exploration industry’s capital investment cycle (particularly shale oil). Moreover, uncertainty pertaining to demand for crude (and in turn finished products) could increase as nations go into lockdown that could stretch for 3–6 months.

    Where do we stand today and who has been impacted?
    According to Pensions & Investments, by the end of March 2020, distressed debt in the US quadrupled in less than a week to c. USD 934m, reaching levels not seen since 2008. Junk bonds are yielding at least 10 percentage points above Treasury yield, while loans are trading less than 80 cents to a dollar. The total value is estimated to be higher as the calculation described above excludes medium-sized companies whose debt instruments rarely trade.

    Distressed debt tied to the oil & gas sector exceeded USD 161bn (at the end of March 2020), up from USD 128bn a week earlier. Except utilities, most other sectors in the US, including transportation, retail, entertainment, telecommunications and healthcare, have reported higher distressed ratios (rising to double-triple digits). Distress in sectors such as automotive and auto ancillaries is even more severe, wherein investment grade companies are at risk as well. Ford Motors recently got downgraded to junk status.

    Consequently, new distressed funds are making headlines
    According to Bloomberg, Highbridge Capital Management plans to launch two credit dislocation funds, worth USD 2.5bn in total; it is expected to complete fundraising in April 2020. Knighthead Capital Management requires additional cash totaling USD 450mn for its distressed debt fund. Silverback Asset Management is preparing to launch a USD 200mn credit fund; it aims to conclude fundraising by April 2020. Centrebridge Partners LP, in March 2020, activated c. USD 3bn of capital it raised in 2016, while Sixth Street Partners, plans to activate a USD 3.1bn contingency fund raised in 2018. Furthermore, Marathon asset management was able to draw USD 500mn into its opportunistic and distressed credit funds.


    What do rating agencies anticipate?

    Fitch recently published a report stating that anticipating price dislocation in high yield bond markets could lead to a surge in debt exchanges. The agency expects such transactions will be treated as restricted defaults. Fitch expects uncertainty in the economy and capital markets to continue in 2020 and anticipates that companies would experience some form of distress. Of these, issuers with unsustainable capital structure would have three options to restructure their obligations: file for bankruptcy or similar insolvency or intervention proceedings, opt for refinancing (typically arising when an issuer’s problem is due to liquidity rather than solvency), or resort to Distressed Debt Exchange (DDE).

    Outcome
    While debt markets (bond and loan prices) have already taken a hit due to the outbreak of COVID-19 and low crude price environment, actual defaults are yet to happen. Corporates will experience deteriorating liquidity conditions to begin with, that would lead to lower headroom to take additional debt and eventually worsen solvency and, in the interim, result in a rating downgrade by a couple of notches. Corporates with single B ratings are most likely to experience the highest probability of default. Sectors with the highest levels of stress would be airlines, aircraft lessors, hospitality, entertainment, energy, automotive.

    Conclusion
    Until the virus is eradicated or vaccine gets developed for Covid-19, the lockdowns, partial or complete, will continue, negatively impacting markets and industries. The debt market is no exception to the trend and will have to go through the grind. Even after the recession or economic downturn is over, it is highly unlikely that things will go back to as they were before. The only way for companies to survive and thrive will be to adjust to the new environment. As default levels rise, the situations will result in opportunities for distressed debt investors.


  60. Gap in demand–supply of masks: Is there a solution?

    As countries fight the COVID-19 pandemic, demand for protective gears is soaring. Masks, especially, have seen unprecedented growth

      to read | words

    As countries fight the COVID-19 pandemic, demand for protective gears is soaring. Masks, especially, have seen unprecedented growth in demand. As the number of cases rises and the acute supply shortage continues, companies and governments are taking steps to bridge the demand-supply gap. The big question is: will demand for masks remain high even after the pandemic is over, or will companies be holding large unused stocks?

    The novel coronavirus has caused widespread havoc. According to the World Health Organization (WHO), 212 countries reported a total of 1,436,198 confirmed cases and 85,522 confirmed deaths as of April 9, 2020.

    Source: World Health Organization (WHO)

    One of the ways coronavirus spreads is when an infected person talks, coughs or sneezes, thereby releasing droplets of saliva in the air. These can then enter the body through eyes, nose or mouth. It can also spread through physical touch/contamination of surface. Protective gears such as face masks, gloves and goggles are very effective in preventing exposure to the virus. This, of course, needs to be supplemented with additional measures such as maintaining personal hygiene and practicing social distancing.

    Masks gaining popularity amid growing awareness
    As the search for the right vaccine against the virus continues, consciousness about using protective gears and practicing safety measures to keep away from infection has increased manifold. Of all the protective gears available in the market, face masks are most popular. Search for medical masks and respirators on Amazon rose 17000% monthly in late February, according to Adweek. Furthermore, keyword search for ‘N95’ and ‘N95 mask kids’ rose 6543% and 2188%, respectively. Even Google Trends attests to the spike in popularity of masks, based on key word searches, during the last two weeks through April 4.

    Face Masks – Worldwide (Past 90 days)

    Face Masks – United States (Past 90 days)

    Source: Google Trends

    An SEMrush study on India, the country with the second highest population in the world, showed that keyword search for ‘n95 mask’, ‘n-95 mask price’ and ‘3m n95 mask’ rose a whopping 1017%, 3002%, and 1962%, respectively, in January 2020 compared to December 2019.

    N95 grade masks are considered more effective in ensuring protection than standard ones. However, they are designed for use in the healthcare industry. The WHO states that if you are healthy, you should only wear a mask when taking care of a potentially infected person. A mask can also be worn if exhibiting common cold conditions, such as coughing or sneezing. The Centre for Disease Control and Prevention (CDC) reiterates both points. However, with the number of confirmed cases skyrocketing in the US recently, the CDC is reviewing its policy and may consider expanding the scope of face mask application. The US is currently leading, with the maximum number of confirmed COVID-19 cases, 395,030 as of April 9, 2020.

    Severe shortage of supply worldwide
    The WHO forecasted in early March that the mask manufacturing industry worldwide would have to increase production by 40% to meet the rising global demand, estimated to reach 89 million medical masks per month. At that time, there were around 90,000 confirmed cases globally. However, the number has shot up more than 10x within a month. Moreover, as of April, most countries are engaged in combating community spread (local transmission) as against dealing solely with imported cases in early March. Consequently, demand for both N95 grade masks for healthcare workers treating those affected as well as standard masks for general public has increased significantly.

    China, the market leader in manufacturing face masks, accounted for half the global output in 2019. In anticipation of the massive supply crunch globally, especially of medical masks, China increased daily production of face masks from 20 million units to 110 million units in February 2020 (according to South China Morning Post). The Washington Post says that more than 3,000 companies in China across industries, such as car manufacturers, energy companies and diaper manufacturers, have tweaked their production lines to include masks, protective clothing, thermometers and medical devices.

    Most developed economies have the capacity to produce masks, but are unable to cater to demand as their existing capacity is falling short of meeting the sudden surge and conditions are not conducive to production. The US, for instance, depends completely on China for the supply of protective equipment. It procures 95% of surgical masks and 70% of tighter-fitting respirators and N95 masks from overseas, particularly China. The country has an inventory for emergency of 12 million N95 respirator masks, but would need significantly more in case of a larger outbreak. The Department of Health and Human Services stated in the first week of March that should the coronavirus outbreak develop into a pandemic in the US, 3.5 billion face masks will be required by healthcare workers, a scenario fast approaching.

    The existing production capacity of the top global mask manufacturing companies is not enough to meet the growing demand. Companies such as 3M and Prestige Ameritech, with production facilities worldwide, are expanding capacity, but this too may not be adequate. In their bid to cater to demand, companies from other industries worldwide are diverting resources and adjusting their production lines to include the manufacturing of face masks. Some examples are:

    Company

    Products known for

    Covid-19 support

    Gap Inc.

    Clothing and accessories

    Plans to manufacture gowns and masks using factory resources

    Denver Mattress Company

    Mattresses

    Restructured its production facility to undertake production of face masks since March 26, 2020

    Fiat Chrysler Automobiles

    Automobiles

    Plans to manufacture and donate 1 million protective masks per month to frontline workers in the coming weeks

    Source: Various

    Is demand sustainable?
    Amid the sharp rise in confirmed coronavirus cases the world over and in the face of acute shortage, the need of the hour is to ensure adequate supply of medical masks for frontline healthcare workers. Demand for N95 grade masks will continue to grow in the near term until the curve of infected cases flattens and then starts to decline. In view of the current short-supply of medical grade masks, Amazon has stopped offering these to the general public. Instead, it is directing the supply toward hospitals, government agencies and other groups.

    Governments are taking stringent measures, such as locking down their respective countries, to prevent the virus from spreading. One-third of the world’s population is already under lockdown. The WHO has warned governments against abruptly ending the stringent measures. Also, it has been made clear by health officials that stopping the current trend of infections is not enough—the virus needs to be eradicated to avert any risk of resurgence. As the lockdown is lifted in phases or across countries, it would be all the more advisable to wear a face mask, which would translate into more demand. President Trump recently suggested that Americans start using face masks regularly. However, he recommended that alternatives be used, such as bandanas, fabric masks or homemade masks, in the light of the acute shortage of N95s or surgical masks and their requirement at hospitals. Therefore, demand for light material masks may rise in future.

    Even after the outbreak has subsided and the disease has been checked, people are likely to follow the same standards of hygiene and protection as they are doing now. Developed countries may take cues from South Korea, Japan, Hong Kong and other Asian countries that have managed to control the spread better than them. A major factor for this could be the general culture among people in some of these countries to wear masks when going out. Amid the increased awareness, demand for light material masks could rise. Companies too may come up with innovative products. For instance, Brooklyn-based company Scough, whose products are increasingly becoming popular, makes stylish wraps around scarves and bandanas with an attached hidden face mask.

    It, therefore, remains to be seen if the strong demand for masks continues or mask manufacturers are left with excess capacity after the pandemic ends, or a wave of cultural shift makes wearing masks the ‘new normal’.


  61. Effect of the COVID-19 outbreak on the global theatrical release business and OTT platforms

    The global economy, initially unaffected by the outbreak of the COVID-19 virus in China in December 2019, could not

      to read | words

    The global economy, initially unaffected by the outbreak of the COVID-19 virus in China in December 2019, could not surmount the successive fallout of the pandemic, that began spreading to other countries by early February 2020 and warranting a near-global lockdown. Although manufacturing, transportation and logistics have weathered the lion’s share of the associated economic impact, the effect on the global film production and distribution business is believed to extend to as far as mid-2021.

    The ‘Oriental’ effect
    According to a PwC report, ticket sales in the Chinese market are expected to rise from USD 9.9 billion in 2018 to USD 15.5 billion by 2023, making the country an important growth engine for the global theatrical release industry. Moreover, there is an increase in Chinese releases with box office performances on par with major Hollywood releases, such as 2017’s Wolf Warrior 2 that amassed an impressive USD 870 million worldwide and topped the list of highest grossing non-English language films—the list is now densely populated by other Chinese-origin releases such as 2019’s Ne Zha and Wandering Earth. The top eight Chinese language releases grossed an average box office receipt of USD 600 million, a coveted milestone for high-profile global releases. However, what makes this even more impressive is that the expenditure on none of these projects exceeded USD 100 million; plus, their theatrical releases were almost exclusively within China.

    This aggressive, self-sustaining motion picture market was among the first to be impacted by the COVID-19 pandemic, that is now spreading across Europe and the Americas. Preliminary reports had indicated a complete closure of approximately 70,000 theatres in mainland China that has resulted in forgone box office revenues of USD 1.91 billion in the first two months since the start of the outbreak. Other debilitating measures include the government halting all local film production and Chinese distributors pulling out of the 2020 edition of CinemaCon, the largest global gathering of film distributors.

    Source: Hollywood Reporter

    Impact on the global box office in 2020 and beyond
    The long-term ramifications of the outbreak continue to evade industry analysts, primarily due to the lack of clarity on a timeline for its containment, especially in the absence of an effective vaccine. With large gatherings in confined spaces common in the entertainment industry, forecasters will now have to factor in lower footfalls in movie theatres even after government-mandated quarantines and associated restrictions are lifted. As the market value of film theatre chains dwindle globally, major film studios have put all theatrical releases with a timeline as far away as June 2020 on hold. A notable tentpole that has fallen prey to rescheduling is MGM’s No Time to Die, with its release window being pushed from April 2020 to November the same year. While exercising caution has been received well by the industry, it is expected to aggravate revenue cannibalization, a crucial issue currently plaguing profitability of high-profile tentpoles and mid-range projects.

    Stock performance of major US movie theatre chains since the outbreak

    Source: Bloomberg

    Theatrical release patterns
    The annual motion picture release cycle starts with the January to March window, a period synonymous with the release of films with risky box office prospects and low performance forecasts. This is followed by the stronger April–June spring cycle and the July–September summer cycle, known as ‘golden-goose’ periods and lucrative holiday cycles like Halloween in late October and the climactic Christmas window.


    As tentpoles from major rival production houses tend to compete against each other in stronger release windows, studios space their release slates by at least one to two weeks, thereby preventing blockbuster fatigue-footfalls usually decrease when blockbusters overcrowd theatres, thereby resulting in weak ticket sales for the successive period.

    Another strategy that studios adopt is to couple their tentpole releases with a mid-range movie in an adjacent release window. This serves two purposes: offsetting the inherent risk associated with a big-ticket release with strong sales from a small-scale outperformer; and providing the audience with a well-spaced refreshing set of choices. An important example is 20th Century Fox’s coupling of its 2009 Christmas releases Avatar and Alvin and the Chipmunks: The Squeakquel. The former, a high-risk venture costing more than USD 400 million and predicted to be a significant commercial disappointment, trounced industry expectations to notch sales of USD 2.9 billion, while the latter performed well enough to warrant two sequels.

    The ‘avalanche’ effect
    The existent delicate timing in the global theatrical industry is now set to be disrupted by the uncertain ‘holding pattern’ currently being observed by major Hollywood film studios. With the previously planned seven to fourteen-day window for each largescale release now practically absent, tentpole releases may have to fight it out in listless random release windows in 2020 and 2021, with all of them thereby failing to break even while setting off a successive chain reaction of rescheduled releases. A plausible example would be Disney’s China-centric Mulan and the 25th James Bond movie, each tied to nearly USD 350 million of production and marketing funds and releasing in the same post-Halloween period in November 2020, with the former being the remake of a highly successful 1998 animated feature, and the latter retaining a sizeable degree of pre-release buzz, due to it being the last entry in the franchise starring Daniel Craig.

    The winners
    In the existing scenario, another major media avenue that will see its customer retention and profitability strengths being put to test is the over-the-top (OTT) platform segment, a domain that has steadily gained traction in the last decade. Industry insiders have reasons to believe that the current business climate would pave the way for a larger slate of premium content from these well-funded conglomerates.

    Recently, the Martin Scorsese crime epic The Irishman, a passion project costing nearly USD 160 million, was given a limited theatrical release and a simultaneous all-territory digital release. This strategy to eliminate the dependence on theatrical revenues was due to the risks of budget overruns and the lack of a family audience base for its adult genre. Substituting wide theatrical releases with exclusive release on OTT platforms such as Amazon Prime and Disney+ is expected to gain momentum as a trend from 2020 onwards. This would be driven by the large number of displaced film releases and by the need to hedge against high levels of spending by OTT players on content production. In 2019 alone, the total budget for original content among major US media and entertainment companies amounted to nearly USD 121 billion, with the top five company-wise budgets accounting for nearly 72.5% of the funds earmarked for the sector.

    Estimated 2019 content spending by entertainment majors

    Source: Variety

    Though signing expensive content deals comes with the associated risk of inheriting potential flops, it also helps streaming players acquire premium studio-produced content with lesser reliance on overbudgeted indigenous content that lack mainstream studio oversight, is debt-funded and is largely raised from junk bonds, as in the case of Netflix.

    Despite utilizing a USD 15 billion budget for original content in 2019, Netflix was still prone to subscriber losses as late as the third quarter of the same year. This was attributed in part to a rise in the cost to acquire a new subscriber, that soared from USD 308 in 2012 to USD 581 by mid-2019. However, its library still contains a large share of externally licensed content (63% as of July 2019) for which it continues to pay royalties. A notable example is the prestigious sitcom Friends, that cost the streaming giant USD 100 million in annual license fees until early 2020, when it is expected to move to HBO Max in a lucrative USD 500 million deal.

    Similar cases of losing high-profile external content exist across all streaming platforms that are expected to weather a crunch in terms of TV and film content in 2020 and beyond, owing to the expiry of content licensing periods. While a novelty factor for pre-existing television and film content exists, spiraling content budgets of major OTT players are not in line with the shares of subscribers tapping into new original viewing material. This is illustrated in the example of Netflix, that is projected to lose nearly 4 million subscribers in 2020, even as debt levels touched USD 14.8 billion the previous year.

    Therefore, by acquiring exclusive rights to competent productions from front-runner production houses at a reasonable premium, OTT platforms can combat subscriber losses with an expanding content library, while reducing pressure on profits margins and spending-induced debt levels.

    On a fair note, given that 2020 is expected to herald the seamless integration of OTT platforms with the global box office, the current slump appears to be a temporary blip on the radar of the global theatrical industry. While the impact of the global lockdown on the survival of these two media avenues is currently unforeseeable, it is very well expected to serve as a playbook for the future of mass entertainment.


  62. AI To Aid in Decision-making During Pandemic

    In today’s technology-driven world, artificial intelligence (AI)-enabled devices are more of a necessity than luxury. With m

      to read | words

    In today’s technology-driven world, artificial intelligence (AI)-enabled devices are more of a necessity than luxury. With more enterprises going online, AI is increasingly becoming relevant. It is also playing a significant role in fighting the global pandemic at various levels. While there are challenges in the adoption of AI, implementing the technology will only ensure organizations are better prepared for similar crises in future.

    Artificial intelligence (AI) and machine learning (ML) are disruptive technologies that can change the way businesses operate, from automation of monotonous repetitive tasks to complex decision-making.

    AI or MI enables a machine or computer to simulate human behavior and perform a task. The software and algorithms used to create AI can imitate human intelligence and enable the machine to think, apply reasoning, solve problems and learn.

    In today’s IoT-connected world, we are constantly surrounded by AI-supported devices. These devices acknowledge our verbal orders, drive vehicles and demonstrate intelligence by giving us right information instantly or directing us to our destination. One of the major reasons why AI will soon become a necessity is its ability to judge situations without involving emotions or biases.

    Role during COVID-19 pandemic
    AI is playing a key role in the healthcare sector since the outbreak of coronavirus. Using it, over 40,000 research reports and studies on COVID-19, SARS and other related coronaviruses have been scanned to gain a better understanding of the disease. These datasets are freely available for ML readability. Therefore, researchers are now able to apply natural language processing (NLP) algorithms to speed up the invention of vaccines.

    China is using temperature screening, powered by advance AI capabilities, in subways and railway stations to check the spread. These systems can screen people from a distance for high temperature within just a few minutes, and identify a potentially infected person, stopping him from exposing others to the virus.

    AI-enabled robots and drones are being used for disinfecting and supplying essentials in some hospitals.

    Hence, it is an important weapon in the fight against the pandemic.

    Other sectors
    Various industries such as automotive, telecommunications, financial institutions, and restaurants, are successfully implementing AI:

    1. Reactive Machines – It does not rely on experience to find solution to a problem. An interesting example of this would be smartphone games. The in-built software plays the role of a competitor, anticipates the moves by the players and reacts to the situation accordingly. The logarithms fed into the system are as per the rule of the game, and there is no strategy based on previous games played.
    2. Limited Memory – Here the machine or device undertakes a task and takes decision after analyzing environmental conditions. This technology has been widely implemented in autonomous cars.
    3. Theory of Mind – This advanced AI helps machines understand human thoughts, feelings and reactions. Understanding complexities of human emotions helps in ascertaining the behavior. The concept also entails creating self-awareness in machines. With increasing use of AI, it is important that machines be embedded with consciousness for accountability of actions.

    Machines built on AI platform are easily adaptive and can handle projects requiring planning, ML, human language processing, robotics, storing and analyzing data, and drawing conclusions. They reduce human efforts by enhancing speed and accuracy.

    Adoption of AI
    Today, AI is increasingly used in the finance industry, transforming the way we handle money. It is helping in streamlining and optimizing processes that were otherwise very time-consuming.

    In quantitative trading, AI and ML are used to predict stock market behavior. Using AI, thousands of press releases, news feeds, company disclosures, financial statements, company filings, earnings calls, and trends in other sectors are scanned, on which prediction is based. AI facilitates auto analysis of historic and current trends of a stock, and comparison vis-à-vis major parameters influencing the market, eliminating hours and even days of manual work by research analysts. Quantitative trading has benefited immensely from AI and ML that have helped in lowering financial risks.

    Companies are building financial models using AI and ML. Large sets of data are sourced automatically and thereafter consolidated on a single location in the client’s cloud-based platform.

    The future
    AI, like every technology, is not immune to disadvantages. Initiation and implementation are expensive, while integration with existing systems may be fraught with several challenges. At times, an organization’s entire technical infrastructure may need to be overhauled. Getting the right talent to support AI and ML requirements is not easy either. Those with the required skillset may come at a high cost. Furthermore, excessive use of AI would render manual efforts redundant, leading to unemployment.

    A global financial survey conducted by Mckinsey revealed the challenges in implementation of AI.

    Most Significant Barriers Faced by Organizations in Implementing AI

    Figure - Survey conducted by Mckinsey.com

    Considering the significant advantages it offers, AI is a critical technology. It has reduced cost, made life better by reducing risks, and speeded up decision-making. Due to these reasons, it has emerged as a potent tool to deal with the current crisis and usher in transformation across sectors, not just healthcare.

    With automation becoming a need of the hour more than ever before, as businesses look to offset the impact of the pandemic on operations, AI’s relevance has only increased. Had more factories adopted AI, businesses would have been better equipped to deal with present adversities.

    AI has certainly increased efficiency, accuracy and reliability across industries. However, this does not undermine the importance of human intervention. The best way forward, therefore, is to ensure that machine and human intelligence go hand in hand.


  63. Will Saudi Arabia and Russia agree on production cuts to save oil market?

    Oil prices are gyrating due to the delay in Saudi Arabia and Russia reaching an agreement on cutting

      to read | words

    Oil prices are gyrating due to the delay in Saudi Arabia and Russia reaching an agreement on cutting production. In a hostile environment, amid oversupply and falling demand, oil prices have become extremely volatile. Due to the pandemic and resultant shutdowns, demand has taken a hit, but market conditions for oil were challenging even in pre-COVID-19 days. With no respite from lockdowns in near future, oil storage facilities may reach capacity soon and logistics would become expensive for producers. Prospects, therefore, hinge on Russia and Saudi Arabia reaching an agreement soon. Expect prices to remain skewed downwards for some more time.

    Oil prices are again weak after last week’s late rally. This was expected as news came in that a likely discussion between Saudi Arabia and Russia, planned for Monday April 06, had been pushed to Thursday, April 09. Further news emerged of an emergency meeting of oil ministers of G20 countries being called on Friday, April 10. Reacting to these developments, oil prices have turned volatile and will react sharply to any speculation until a concrete and executable plan emerges soon.

    Exhibit 1: Sharp fall in oil prices in March 2020 (USD/bl)

    Source: Reuters Eikon

    Currently, demand is severely restricted. Going by estimates provided by the Chief Economist at trading firm Trafigura, the daily global demand would decrease by as much as 30mbpd or about one-third due to the lockdowns across the world. In 2019, oil prices were already under pressure amid decelerating global growth and slowdown in major consumer markets such as China. Hence, even after the world recovers from this epidemic, the timeline for which is highly uncertain, demand for oil would remain subdued.

    In the past two years, the only support for oil price was to adjust supply as per demand. Since production is spread across OPEC and many other producers, they needed to agree on curbing it. This was attempted successfully in 2018 and 2019 by OPEC and select non-OPEC producers, including Russia, when nearly all producers in the group adhered to a set production amount as per mutually agreed quotas. Some producers like Russia fell behind in cutting production, but Saudi Arabia more than made up for the gap by cutting more than its quota. However, this arrangement did not include the world’s largest producer, the US. Competition laws prevent US producers from being part of any such agreement, lest they are directed by their local states to curtail production. The federal government does not have much say in this matter and leaves the market to be governed by demand and supply. This was confirmed last week based on what the US President had to say after his meeting with oil market executives.

    The agreement between OPEC+ group of producers ended amid discord in March 2020; producers were now free to increase production, which removed the very support that had propped oil prices until now. Hence, it was not surprising that prices collapsed by over 50% in March. The only solution now is to once again reach an agreement to cut output which, however, looks difficult, considering the acrimony between the top producers, Saudi Arabia and Russia. Going by public comments from officials of both countries after the production-cut agreement ended, the two are not on the best of terms. Nevertheless, both countries are aware of the importance of keeping discussions alive for mutual benefit, and hence, the attempts to reinitiate talks. This time, Saudi Arabia has invited the Texas Commission to the discussion. The State of Texas, with many shale oilfields, is a key stakeholder and has the authority to direct producers to cut output. It can also act independently without attracting any action as per competition laws, by virtue of being a government body, unlike the other two industry associations: the US Oil & Gas Association and Independent Petroleum Association of America.

    Warehousing the increasing supply of oil is another bomb that is ticking away, as storage is limited. Top storage facilities, such as those in the Emirate of Fujairah, are running out of capacity and expected to be filled up within a short span of few weeks. Even the US, which initially purchased oil for filling up strategic reserves, has ceased to do so. Oil data analytics firm Oiix has estimated that oil storage around the world could reach 1 billion barrels soon. Sources from shipping industry estimate that as much as 80 million barrels of oil are being stored in floating vessels around the world. If the world runs out of storage space, all producers will be forced to cut production with or without a deal. Indeed, as per media reports, at least 900,000 barrels per day of production in the US have been curtailed by "shut-ins".

    Exhibit 2: Sharp rise in stored oil in March 2020 as demand falls but supply increases

    Source: Bloomberg

    This extreme situation has forced some producers to pay for transportation of oil sold to refineries, effectively meaning that certain varieties of oil (e.g. Wyoming Asphalt Sour) are being sold at negative rates, or sellers are paying buyers. The situation is especially severe for producers that are inland and have landlocked pipelines, like those in the US, Canada and Russia. Goldman Sachs estimates that WTI benchmark prices may even go negative as a result of the constraints mentioned above. The scenario is not very different downstream, as refineries also find that offtake for petrochemicals is falling in a world affected by the global slowdown. As refineries run out in terms of capacity, especially for those with older, less productive oil wells as the source of feedstock, the oil pumped out will literally have nowhere to go with regard to either usage or storage. Amid the supply glut and rising demand for storage, storage costs are spiraling. Research firm JBC Energy estimates that such ‘no-use’ crude would be around 6 million barrels per day in April and reach 7 million barrels per day soon.

    Eventually, the epidemic will subside, economic activities will resume, and transportation and industrial demand for oil will increase, although the timeline remains uncertain. However, until then, oil markets would remain subdued, with small spikes whenever some positive news surfaces. All eyes are on Saudi Arabia and Russia – whether they will agree to return to negotiations and how soon. Saudi Arabia has demonstrated its inclination to production cuts and taken leadership position in cutting more than its quota in the past. Other oil producers, except Russia, have mostly followed Saudi Arabia in compliance. However, it will be critical to see whether Russia will agree to any production cuts, and given the recent acrimony, will Saudi Arabia be keen on holding talks again. The rescheduling of discussions from Monday to Thursday is just a short delay, but what is important is that the oil market has comprehended the challenge in getting the two parties to the table and reacted accordingly. Expect prices to remain skewed downwards for some more time.


  64. Yes Bank Fiasco: End of AT1 bond issuance in India?

    Yes Bank had been under stress for some time, marred by low capital adequacy and asset quality issues.

      to read | words

    Yes Bank had been under stress for some time, marred by low capital adequacy and asset quality issues. RBI, which had been monitoring the situation closely, has now decided to step in and act decisively. Its sudden decision to impose a moratorium and announce restructuring has caught markets and investors unaware. One of the casualties of the proposed restructuring are the AT1 bondholders, whose entire investments would be written down and rendered worthless. This then raises the question: is the solution viable? Is this the first time that bonds are being written down, while equity investors are being compensated?

    Yes Bank’s stock has been soaring, contrary to the widespread fall in Indian equities, driven by the positive news of rescue by SBI and upcoming removal of restrictions on deposit withdrawals. However, fixed income investors have been dealt a severe blow. Investors in additional Tier 1 (AT1) bonds of Yes Bank received a rude shock on March 15 after the bank announced that it will write down AT1 bonds worth INR84.15bn to zero. This includes the perpetual subordinated Basel III-compliant bonds worth:

    1. INR30.00bn issued on December 23, 2016; and
    2. INR54.15bn issued on October 18, 2017.

    The write-down implies bond investors are paying for the excesses committed by the management. The write-down is the last chapter in the bank’s bailout proceedings that started with RBI placing Yes Bank under moratorium on March 5 and replacing its board after its near failure. On March 13, RBI announced a reconstruction scheme worth INR100bn led by SBI, which will now own a 49% stake in Yes Bank. The scheme prescribes a three-year lock-in period for shareholders holding more than 100 shares. The scheme will protect depositors, senior bondholders and equity shareholders, but AT1 bondholders have been left in the lurch with total write-down of their holdings.

    What are AT1 bonds?
    AT1 bonds are additional Tier 1 bonds issued by banks to boost their capitalization. As of 2019, Indian banks need to maintain a minimum common equity ratio (CET1 ratio) of 8%, Tier 1 ratio of 9.5% and total capital ratio (capital adequacy ratio) of 11.5%. These capital requirements are 1% higher than the Basel requirements. The 8% requirement needs to be met by common equity and retained earnings, 1.5% can be met through AT1 bonds and the remaining 2.0% through Tier 2 bonds.

    AT1 bonds are Basel III-compliant that act as buffers for banks in times of stress; hence, they are quasi-equity in nature. These are subordinated-perpetual bonds with a call option in five years. Other key features of AT1 bonds are capital trigger and principal loss-absorption. Once the issuing bank’s capital falls below a certain level, the trigger gets activated and the bonds can be partly or fully written down on a temporary or permanent basis or the bonds can be converted into equity. Basel regulations also allow for a discretionary trigger called as the Point of Non-Viability Trigger (PONV), which can be activated by a country’s banking regulator, if it believes that such action is necessary to prevent the issuing bank’s insolvency.

    Investors in AT1 bonds face an additional risk of non-payment of coupon. In case, a bank makes losses in a particular year, and if its capitalization goes below the minimum threshold on payment of coupons, the bank has the discretion to skip coupon payment on its AT1 bonds. The coupons are non-cumulative, and the bank has no obligation to pay the missed coupon.

    What happened with Yes Bank AT1 bonds?
    Under the restructuring scheme announced on March 14, RBI proposed a complete write-down of AT1 bonds worth INR84.15bn, while protecting equity holders’ interests. RBI plans to recapitalize the bank by injecting equity totaling INR100bn, led by SBI and other lenders, with a three-year lock-in period.

    On March 14, Yes Bank announced results for Q3 20, posting a net loss of INR185.60bn. The bank’s CET1 ratio fell to 0.6% in Q3 20 from 8.7% in Q2 20, while capital adequacy ratio slipped to 4.1% from 16.3% over this period. The weakening of financial position was attributed to the bank booking significant provisions (INR247.66bn) in Q3 20, given the deterioration in asset quality. Gross NPL ratio rose to 18.9% in Q3 20 from 7.4% in Q2 20.

    Prior to the announcement of moratorium, Yes Bank’s shares were trading at INR36.8; the share price slid to INR16.15 on March 6 following the imposition. Subsequent to the news of the restructuring scheme, Yes Bank’s shares have rallied significantly to touch INR60.80 as of March 18; while this means extraordinary gains for equity holders, AT1 bondholders’ hopes have been dashed.

    Yes Bank Share Price Performance

    Source: MoneyControl


    Key Features of the Yes Bank AT1 bonds

    Amount Issued

    INR30.00bn

    INR54.15bn

    Issue Date

    December 23, 2016

    October 18, 2017

    Coupon

    9.50%

    9.00%

    Maturity

    Perpetual

    Perpetual

    Ranking

    Subordinated

    Subordinated

    Basel III compliance

    Yes

    Yes

    Secured/Unsecured

    Unsecured

    Unsecured

    Convertible/Non-Convertible

    Convertible

    Non-Convertible

    Coupon Discretion

    Yes

    Yes

    Loss Absorbency

    Upon occurrence of the following trigger events:

    • Pre-Specified Trigger Level
    • Point of Non-Viability (PONV)

    Pre-specified trigger level

    If CET1 falls below 5.5% of RWA before 31 March 2019
    OR
    If CET1 falls below 6.125% of RWA on or after 31 March 2019

    PONV trigger

    The earlier of:

    • a decision that a permanent write-off without which the bank would become non-viable, as determined by the RBI
    • the decision to make a public-sector injection of capital, or equivalent support, without which the bank would have become non-viable, as per the RBI

    Whether AT1 can be written off before equity capital

    Yes under both events

    Source: Yes Bank Bond Offer Document

    In a global context, this is not the first time AT1 bonds are facing losses. Although technically AT1 bonds are liable for losses, going by the precedent globally, they have always been accompanied by an equal or more severe loss to equity shareholders. However, in the case of Yes Bank, AT1 bondholders are worse off compared to equity shareholders.

    Global precedents

    Banco Popular’s EUR1.25bn AT1 write-down – A case of resolution without state aid
    On June 7, 2017, the Single Resolution Board (SRB), EU’s Central Resolution Authority for banks, put Spanish lender Banco Popular under resolution. The bank was considered likely to fail, given the significant outflow of deposits and deterioration in asset quality. The capital hole was plugged by writing off AT1 bonds worth EUR1.25bn and equity shares worth EUR1.38bn (Banco Popular’s shares were trading at EUR0.33 before suspension); and issue of fresh equity worth EUR7bn by acquiror Banco Santander. Under the European Commission’s directive, Banco Santander took over Banco Popular for a symbolic value of EUR1. The Tier 2 instruments were converted into equity. The AT1 write-off was in line with the bail-in resolutions applicable for European banks as per the Bank Recovery and Resolution Directive (BRRD).

    Institutional investors PIMCO, Anchorage Capital Group, Algebris Investments, Ronit Capital and Cairn Capital filed a lawsuit in the European Court of Justice against EU authorities for not conducting a definitive valuation of the lender. The lawsuit is ongoing.

    For retail investors, Banco Santander launched a EUR1bn scheme. Under it, fresh bonds were to be issued free to customers on condition that their rights to pursue legal action against Santander would be waived off. The bonds would be perpetual but redeemable after 7 years and would pay 1% interest annually. The voluntary measure was aimed at maintaining customer relationships.

    Monte Dei Paschi Di Siena’s AT1 and T2 bond swap: A case of state bailout
    In July 2017, Italian lender Monte Paschi was given a EUR5.4bn state bailout in conjunction with a deal to swap EUR4.3bn of subordinated bonds with equity. The bank’s capital shortfall was EUR8.1bn and the bailout resulted in the state owning a c70% stake in the bank.

    The bank offered 100% of face value for T2 bonds and 75% for T1 bonds. Monte Paschi earmarked EUR1.5bn to compensate retail junior bondholders who were mis-sold the bonds.

    Banco Espirito Santo’s EUR2bn senior bond wipe off – A case of selective loss imposition
    Portugal’s private bank Banco Espirito Santo (BES) failed in 2014 due to fraudulent activities conducted by the Espirito Santo family, its private owners. The Portuguese central bank announced a resolution plan under which BES was split into a “bad bank” with toxic assets; and a “good bank” Novo Banco. The bad bank housed those shareholders and subordinated debtors who were to be written down against the bad assets that mainly consisted of exposure to Espirito Santo Group companies and BES’s Angolan unit; the new bank, on the other hand, housed depositors, senior debtors and other viable assets. The good bank was recapitalized by EUR4.9bn from the Portuguese Resolution Fund.

    On December 29, 2014, the Portuguese central bank decided to transfer senior bonds worth EUR2bn from Novo Banco to BES, essentially making them worthless. The central bank selected 5 out of 52 outstanding bonds to be transferred to the bad bank. The transfer was meant to plug a EUR1.4bn capital shortfall in Novo Banco. The senior bonds were not owned by retail investors. Institutional investors such as BlackRock and Pimco that were holding the senior bonds launched legal action against the Bank of Portugal, which is still under review by the court of law.

    Conclusion & Key Takeaways
    In all the instances mentioned above, equity shareholders’ value was also wiped out along with AT1 bondholders’ value. Moreover, wherever retail investors were impacted, authorities have taken steps to protect their interests. However, in the context of Yes Bank, this is the first time in history that losses are being fully imposed on AT1 bondholders, while equity shareholders are being compensated and are even enjoying the rewards of the uptick in share prices following the announcement of restructuring. Retail investors have also been left holding the short end of the stick.

    The key takeaways from this episode:

    • A better price discovery process is required for AT1 bonds to accurately reflect the underlying risks.
    • Investors should be educated more widely to make them aware of the features of AT1 bonds, especially highlighting risks involved in case the bank fails.
    • Strict regulatory action needs to be taken regarding mis-selling of AT1 bonds.
    • Selling AT1 bonds to retail investors should be strictly prohibited.
    • AT1 bondholders should be compensated in line with international norms in case the bank fails.
    • Compensation needs to be provided to protect the interest of vulnerable retail investors in AT1 bonds who were not fully aware of the risks and to whom the bonds were mis-sold.

    There is an urgent need to implement the measures mentioned above for the revival and sustenance of the AT1 bond market in India.


  65. Multivariate Model - An Optimal Method for Valuing Football Clubs?

    The Multivariate Model is a well-known method to carry out the valuation of football clubs. Its main components

      to read | words

    The Multivariate Model is a well-known method to carry out the valuation of football clubs. Its main components are revenues, transaction fees cost, assets owned by clubs. While a more optimal approach compared to DCF and Relative Valuation, it also suffers from certain limitations.

    The Multivariate Model, developed by Tom Markham in 2013, is used for the valuation of football clubs. It is essentially a multiplier model wherein the fundamental variable is revenue, which is multiplied with certain other variables. It is a variation of the Revenue Multiple approach, with the underlying principle being that a sports franchisee’s ability to make money in the future determines its valuation. Revenue generation capacity depends on three important factors:

    1. League, with its revenue streams and player salary cap
    2. Stadium and related capacity, corporate boxes, sponsorship and advertising
    3. Market, including corporate presence and demographic catchment area

    As per Markham, “The main assets of a club, typically a stadium, training ground and player registrations, need to be weighted up versus the liabilities (normally trade creditors and debt)”. Accordingly, net profit and the club’s net assets are included in this model.

    Club value = (Revenue + Net Assets) * [(Net Profit + Revenue) / Revenue] * (% stadium filled) / (%wage ratio)

    Revenue + Net Assets: Revenue includes the cash generated in a financial year. Adding net assets to revenues helps determine the club’s current and future cash generation capability; it is, thus, the backbone of this valuation model.
    (Net Profit + Revenue) / Revenue: This ratio examines a club's profitability in comparison to its revenue. Thus, for profitable clubs, the Revenue + Net Assets will be multiplied by a number greater than one, enhancing the valuation.
    (% stadium filled) / (% wage ratio): The numerator in this ratio, i.e. the average utilization percentage, illustrates how effectively a club is using the stadium, its core differentiating asset. Higher the stadium’s utilization, higher the valuation. The wage ratio denotes the club’s ability to control its major expenditure, player costs. Higher the player wages, lower the ratio and vice versa.

    This leads us to the assumption that revenues are the most important factor in determining a football club’s value. Wage ratio and percentage of stadium filled jointly determine nearly one-third of a football club’s value and are the most relevant indicators of the management’s ability to control costs and exploit assets.

    Major Sources of Revenue
    All football clubs have three major sources of revenue.

    Commercial: Football clubs monetize their global brand via (i) sponsorship and (ii) retail, merchandising, apparel & product licensing. Commercial revenues are largely controlled by the club and, hence, less dependent on market cycles. Liverpool reported a 23% YoY surge in commercial revenues in FY2019, mainly due to sponsor bonuses following success at the UEFA Champions League.

    Commercial revenues of top football clubs in FY2019 (EUR mn)

    Source: Club website

    Broadcasting: It is derived from the global television rights related to country-specific leagues (Premier League, Ligue 1, La Liga, Serie A, and Bundesliga), UEFA club and other competitions. In addition, certain clubs earn from their wholly owned global television channels.

    Broadcasting revenues of top football clubs in FY2019 (EUR mn)

    Source: Club website

    Matchday: It is a function of the number of games played at the club’s stadium, size and occupancy, and prices of tickets. A significant driver of revenue under this category is the number of home games played at the club’s stadium. Real Madrid reported highest matchday revenue in FY2019, totaling EUR 175mn. This was due to high attendance at the Santiago Bernabéu stadium in the 2018/19 season: 1.7mn members and fans, with over 450,000 tickets sold.

    Matchday revenues of top football clubs in FY2019 (EUR mn)

    Source: Club website

    Analysis of Top 20 Clubs
    While matchday revenues depend on the capacity of a club’s stadium, broadcast revenues depend mostly on the auction of TV rights. Hence, commercial revenues become important for a club’s financial performance as sponsorships are signed for the foreseeable future. However, since 2015, the importance of broadcast revenues has increased, mainly due to higher rewards by UEFA for clubs competing in the Champions League, and country-specific leagues signing profitable TV deals. Accordingly, broadcasting revenue for the top 20 clubs expanded at a compounded annual growth rate (CAGR) of 11% between FY2014 and FY2019, and surpassed commercial revenue (that grew 8.0%) in terms of contribution. Over the past several years, lucrative broadcast revenues have provided huge pay-outs to clubs. However, the broadcasting segment is evolving, especially with Facebook, Google, Netflix, Amazon, and Apple entering the football broadcast space. Hence, during the phase of disruption, having a bigger proportion of a controllable source of revenue is advisable for clubs.

    Revenue split of top 20 clubs in overall revenues (%)

    Source: Football Money League Report 2020, Deloitte Sports Business Group

    Commercial revenues are very important, but only top clubs can monetize their brand. Clubs such as Barcelona and Manchester United have significant international presence, and therefore the scope for raising money from merchandise sales and sponsorship is huge. There are disparities even among the top 20 clubs as can be seen from the chart below. In FY2019, commercial revenues for the top five clubs (in terms of gross revenue) accounted for 49% of their total revenue. However, the contribution keeps declining as one goes down the pecking order.

    Revenue breakup (%) by club rank in overall revenues

    Source: Football Money League Report 2020, Deloitte Sports Business Group

    The single most important cost associated with football clubs is registration of players, which is factored in the Multivariate Model.

    Player Costs
    The transfer fees paid by football clubs to acquire the services of a certain player have skyrocketed in recent times. In 2017, PSG bought Neymar for a staggering EUR 222mn from Barcelona. Valuing a player accurately is a difficult task. Football clubs value players based on either historical cost or replacement cost or market-based cost. Players are valued based on their status in the squad, position, league they are playing in, age, talent, and fame.

    Top five most valued football players

    Player

    Club

    Country

    Age

    Value (EUR mn)

    Kylian Mbappe

    PSG

    France

    20

    219

    Harry Kane

    Tottenham

    England

    25

    200

    Neymar

    PSG

    Brazil

    27

    197

    Raheem Sterling

    Man. City

    England

    24

    186

    Mohammed Salah

    Liverpool

    Egypt

    27

    184

    Source: CIES Football Observatory

    Along with revenues and player costs, the Multivariate Model takes into consideration the core differentiating asset of a football club – stadium.

    Major Asset – Football Stadium
    A club-owned stadium generally means an opportunity to generate additional revenues. Apart from matchday ticket sales, football stadiums also earn from hospitality ticket sales, concerts and other events, naming rights, food and beverages sales, and stadium tours.

    Top five largest European club-owned football stadiums

    Stadium

    Club

    Capacity

    Camp Nou

    Barcelona

    99,354

    Signal Iduna Park

    Dortmund

    90,000

    Estadio Santiago Bernabeu

    Real Madrid

    81,044

    San Siro

    AC Milan

    80,018

    Old Trafford

    Manchester United

    75,811

    Source: Stadium Guide

    Pros and Cons of Multivariate Model –
    Pros –

    • Is a straightforward approach but not too simplistic like Revenue Multiples technique
    • Uses audited accounting data and industry-specific KPIs for an industry that has starkly different characteristics in comparison to regular corporates
    • Gives scope for flexibility as the variables in the formula can be suitably adjusted to reflect the true position of various clubs

    Cons –

    • Rigid underlying assumptions with high emphasis on revenues

    Conclusion:
    Compared to traditional approaches for valuation of companies, the Multivariate Model is more effective as the Market Capitalization method cannot be universally applied due to a smaller number of public listed football clubs. Moreover, the Discounted Cash Flow method requires clarity on profitability and reliability of operational forecasts, both challenging parameters for football clubs, given the inconsistency in profitability and unpredictability of a team’s on-field performance. The Revenue Multiples technique, on the other hand, is too simplistic and fails to consider a club’s assets, liabilities and ability to control costs and profitability.
    Hence, due to the use of industry-specific KPIs and its applicability to any football club, the Multivariate Model has an edge over traditional methods of valuation.


  66. Efficient Corporate Governance Framework - Essential for Success

    Corporate governance refers to a necessary framework adopted by companies to safeguard the interests of customers and other

      to read | words

    Corporate governance refers to a necessary framework adopted by companies to safeguard the interests of customers and other stakeholders. An efficient corporate governance structure can ensure positive returns for shareholder. Moreover, with ESG increasingly being recognized as a key component of corporate governance, this ensures that the company meets its obligations toward the environment and society.

    A company is a group of stakeholders coming together from diverse backgrounds to fulfill common goals. It is an amalgamation of owners, employees, partners, investors, customers, government, and most important – society.

    In the highly competitive business environment today, it is important to understand the inter-relations between various stakeholders. Moreover, many companies nowadays have global presence, with business transactions across countries. In such a scenario, how does a company safeguard the interest of customers without compromising on its obligation toward other stakeholders? Which rules and regulations should it adhere to? Does it need to customize its protocol for every country? How does it stay ahead of competitors?

    Corporate governance has evolved to include performance governance, and efficient competition and risk management. It helps ascertain whether the business is functioning as per legal standards and will it meet the long-term goals of stakeholders. It ensures transparency and accountability. Timely review of control systems of subsidiaries, measures to avoid conflict of interest between different stakeholders, and steps to ensure adherence to government regulations and societal standards go a long way in building credibility. Corporate governance, therefore, tracks how a company is coping with the internal and external environment and associated challenges.

    Why is corporate governance key to improving performance? A strong corporate governance structure, including compliance with codes, helps a company develop a strong risk appetite. Streamlining financial and legal processes in line with rules and regulations makes it easy to spot fraudulent activities. Close monitoring of projects assists in improving performance.

    Though complex to implement, if the company adheres to corporate governance codes, it creates a win-win situation for itself and its stakeholders. Adherence gives shareholders the confidence that their interests are protected, and actions taken by the company are directed toward the overall growth of the organization.

    An increasing requirement under corporate governance is adoption of Environment, Social and Governance (ESG) principles. It is becoming a norm for investments by companies. ESG principles not only entail adoption of environment-friendly practices but also addressing social issues concerning labor practices, talent management, product safety and data security. Shares of ESG-compliant companies usually do well. Investment in ESG compliance more often than not renders corporate governance foolproof.

    Corporate governance provides a strong framework for an organization to achieve its objectives. It encompasses every aspect of management, from operational plans and internal controls to balance sheet checks and corporate disclosure.

    At Aranca, we have a well-defined process to help asset managers evaluate public companies’ compliance with corporate governance norms. The process includes data collation, sanitization, validation and analysis around the broad parameters of the corporate governance framework of a company. We also scan the details and reports of various companies incorporated in the same sector across the globe to review their adherence vis-à-vis that of peers. These reports include corporate governance report, audit report, annual reports, Pillar 3 reports, registration documents, proxy statements, 10K reports, different types of committee reports, etc.

    The data points collected are a company’s general information, list of board of directors, their workload in terms of meetings attended and any other fulltime roles, executive committees, remunerations for the board and the executive committees, shareholder information, board of directors’ biographies, auditor analysis, and the company’s risk profile. Extensive research is done on these executives to establish their experience in the finance and risk domains. Thereafter, the data is sent for 100% validation by reviewers.

    The client benefits from the research data collected and validated by Aranca. Asset managers use this data to make decisions.

    The image below illustrates the delivery framework deployed by Aranca to assist asset managers with corporate governance-related data. This data can help companies and investors in doing a peer comparison as well as understanding a company’s viability.

    Delivery Framework


    A prototype of analysis conducted is given below.


    We believe an effective corporate governance framework in an organization can lead to positive returns for shareholders. Hence, asset managers typically want to evaluate the efficacy of corporate governance in a company before making their investment decisions.


  67. Debt Settlement Industry in US

    The American dream has always attracted people from across the globe. But sadly, today this lustrous dream is

      to read | words

    The American dream has always attracted people from across the globe. But sadly, today this lustrous dream is losing its sheen due to the growing debt crisis the country is grappling with. Those classy chip-embedded cards or credit cards, as they are known, have proved to be a boon for some while a bane for the others. Total consumer debt, comprising credit cards, mortgage, student loans, and auto loans, in the US climbed to $13.2bn as of Q2 2019. How is the country and its citizens going to escape the enormous debt they have hanging over them?

    Debt Scenario in US
    The national debt of the US, or any other nation, is the amount that the government owes to its creditors. The diagram below depicts the state of national debt in the US from 2014 onward and the estimate between 2019E and 2024E. As of 2015, the US economy had been suffering from a trade deficit for over a decade, represented by higher imports than exports during those years.

    US National Debt ($ trillion)

    US National Debt ($ trillion)

    Source - Statista

    The scenario of consumer debt is equally appalling. Total consumer debt climbed to $13.26 trillion as of Q2 2019. This debt is further divided into home, auto, student, and credit card debt.

    Four main areas of personal debt ($ trillion) as of Q2 2019:

    Personal Debt in US as of Q2 2019

    Personal Debt in US as of Q2 2019
    • Total mortgage debt stood as high as $9.4 trillion, up by $407 billion compared with the same period in 2017.
    • Overall auto debt reached $1.3 trillion, denoting a difference of $59 billion from the same period a year ago.
    • Student loans reached a record high of $1.48 trillion, an uptick of $73 billion as against Q2 2018.

    Source – Debt.org

    Credit Card Debt
    In Q3 2019, credit card loans crossed the $1 trillion mark, reaching an all-time high of $1.08 trillion. This is technically a revolving debt as it can be used repeatedly if the credit limit is adhered to and payments are made on time.

    Number of borrowers by loan type (in million)

    Number of borrowers by loan type (in million)

    Source – Wallethub, Debt.org

    The burgeoning debt of the American citizens can be attributed to their incessant and unnecessary spending patterns. Even though the country was at the top of the GDP game in 2016, it continues to get sucked into the debt trap.

    Some credit card trends as of Q2 2019:

    Credit card trends as of Q2 2019

    Source – Debt.org

    This situation of limitless and haphazard spending has led to an increasing number of defaulters in this space.

    These are the ramifications that generally follow if a person defaults on debt in the US:

    • Chapter 7 – Under Chapter 7 of the Bankruptcy Code, non-exempt assets (any property that can be sold by the court) of a person are used to repay the creditors as per the bankruptcy provision. It is different from Chapter 13 of the Bankruptcy Code as there is no paper filing for repayment.
    • Chapter 13 – Under Chapter 13 of the Bankruptcy Code, a person can keep the property and pay instalments as per a repayment plan over the next 3–5 years. This usually suits people with a fixed income stream.

    Since these outcomes are daunting for any person to bear, some companies provide other solutions or alternatives wherein the person’s assets are not sold by the court and the person can come out of debt as well. These alternatives are mentioned below:

    • Debt Settlement – This method of getting debt free is fast and less expensive. The debt repayment terms are negotiated by professionals, and the defaulting party pays only a fraction of the owed amount.
    • Debt Consolidation – Under this debt management strategy, multiple debts are consolidated into a single payment. Usually, the borrower ends up paying at a lower interest rate compared to what was being paid earlier on various debts.
    • Credit Counselling – Companies forge close relationships with credit card companies on behalf of the customer. They try to lower the interest rate by deliberating with these companies.

    Debt Settlement Services
    Debt settlement service providers work on behalf of a financially distressed client by negotiating the settlement terms with creditors and assisting the client in relieving debt. Players in this industry position themselves as customer advocates.

    Companies operating in the debt settlement industry mainly cater to credit card outstanding and other unsecured debts such as medical bills, repossessions, and certain business debts. Some of the majors in this space are Freedom Debt Relief and National Debt Relief.

    The table below gives a glimpse of how the industry has been grown since 2012:

    Fee Model

    2012

    2015

    2017

    CAGR (%)

    Total Clients Enrolled

    56,000

    165,000

    397,000

    47.9%

    Total Accounts Enrolled

    354,000

    1,133,000

    2,904,000

    52.3%

    Total Debt Enrolled

    $1.7bn

    $5bn

    $12bn

    47.8%

    Source – American Fair Credit Council

    The functioning of the debt settlement companies is as follows:

    • Debt settlement service providers have access to a database with information and details of individuals on the verge of defaulting on their personal debts.
    • They contact the distressed potential customer and share details of their services with them. If they are hired, they begin work on the customer’s behalf.
    • They deliberate with creditors and try to negotiate reasonable terms of repayment by lowering the amount to be paid per dollar owed. For example, paying around $0.60 per $1 owed.
    • After negotiation, a repayment plan is made, and the customer then proceeds to make monthly payments that are deposited in an escrow account and after a required time period transferred to the creditor(s).

    An intriguing feature of this industry is its countercyclical nature; hence, it performs well during periods of economic downturns. The industry also makes revenue in a growing economy as it makes people act irresponsibly and spend more than their capacity, thus making it difficult to repay. This creates a pool of customers for debt settlement companies.

    Similarly, during times of a slowdown, such as recession, the number of customers shoots up again because of higher job losses, low salaries, and so on, making people prone to defaulting on existing debts. Hence, the growth of the debt settlement industry is strongly linked to consumer lending.

    Two types of models prevalent in the industry: Legal model and Performance model.

    The distinction between the two models is given below:

    • Under the legal model, a company can charge an upfront fee, meet customers in person, and can have its own lawyers to negotiate with creditors. Moreover, customers do not need to go for hearings in the court of law as it is taken care of by the attorneys.
    • Debt settlement companies operating under the performance model cannot charge an upfront fee from customers as they are prohibited by the Federal Trade Commission Rule 2010. However, legal model-based companies are exempted from this rule.
    • Under the performance model, a company can charge fee based on performance, which is a percentage of the debt balance. For instance, a person had an outstanding debt of $2,00,000 and the debt settlement company negotiated with the creditor for a total debt repayment of $1,00,000. Now the debt settlement company will charge a fee of (say) 25% on 100,000 (debt balance or the amount to be paid to the creditor).

    A Promising Industry
    The debt service industry got the required nudge during and after the financial crisis of 2008–10 due to expansion in credit card debt. It is poised for further growth in the coming years, driven by several favorable factors:

    • A reduction in personal savings, a mushrooming of debt, an increase in household financial leverage – all point to the expansion of the debt settlement industry, as debts will continue to grow.
    • Debt settlement serves as an alternative to bankruptcy, which could taint a person’s image and lead to a public record with a poor credit history.
    • These companies are experts in negotiating with creditors when it comes to minimizing the outstanding debt.
    • The industry is attracting substantial investments from private players in the US. For instance,
      • In December 2013, Vulcan Capital invested around $125 million in Freedom Financial Network.

    The industry now has many active major players and may soon have M&As in a bid for consolidation. More investments from other corporates seeking to expand or diversify their operations in the US will also be seen. Since people earn more and spend even more, and because no one wants to taint their image through court hearings and poor public financial records, I think that the debt settlement industry will soon gain popularity with an ever-expanding customer base.


  68. Will the oil market plunge sink all producers?

    The bloodbath witnessed by the crude oil market on the weekend of March 08, a ‘seismic’ event of sorts, saw

      to read | words

    The bloodbath witnessed by the crude oil market on the weekend of March 08, a ‘seismic’ event of sorts, saw oil prices nosedive to record lows. First, on Friday, March 6, news came in that talks between OPEC and select non-OPEC countries led by Russia for the extension of production cuts had collapsed; this implied that all producers would be free from April 1 to pump as much oil as they could. The likely result would be an oversupply in a market already grappling with slowdown in demand following the outbreak of coronavirus. Second, on Saturday, March 7, there was news of Saudi Arabia offering discounted prices to customers in line with its aggressive strategy to increase market share. This could potentially prompt producers across markets to cut prices in their bid to garner a bigger share. The overall impact was a mayhem in oil prices that led major research houses to substantially revise price targets downward. The developments may have far reaching negative impact, albeit in varying degrees, on all oil producers, from GCC countries to Russia to US shale oil producers.

    Why the talks failed
    OPEC and select non-OPEC producers led by Russia had to a large extent successfully implemented self-imposed production cuts to rebalance the demand-supply gap since December 2018. The agreement to cut production by up to 1.2 million barrels of oil per day agreed in Q4 2018 rather took markets by surprise. Even Saudi Arabia decreased production by more than its quota, as it looked to take the lead and set an example for other producers to follow. As a result, oil prices recovered from the bear phase reached in early Q4 2018. Throughout 2019, subsequent similar decisions by the OPEC+ group indicated its commitment to address the demand-supply imbalance, as some of the biggest consuming economies, such as China and India, witnessed a slowdown. The recovery in oil prices also helped Saudi Aramco IPO sail through in Q4 2019.

    Despite this, other developments had built pressure on the fragile arrangement between a wide group of oil producers. Saudi Arabia was unable to persuade Russia to completely comply with its share of production cuts, crucial for the OPEC+ group to implement its strategy. The US, not part of this group, kept on increasing production, led by private shale oil producers vis-à-vis the government controlled producers of Saudi Arabia and Russia. The US became the world’s largest producer in 2019, thus upending the strategy of OPEC+ producers to tilt the demand-supply imbalance in its favor. Furthermore, Russia had been affected due to several sanctions imposed by the US and European countries following its annexation of Ukraine’s Crimea province. In February 2020, the US imposed sanctions on Rosneft, the flagship oil and gas producer of Russia. Eventually, matters came to a head during the meeting on Friday, March 6—it was announced that producers were not bound by their early agreement to continue complying with production cuts.

    Based on known production capacities as of date, Saudi Arabia can quickly increase production to 11 million barrels per day from less than 10 million barrels per day currently. Russia can also raise production by 130,000 barrels per day. Overall, a combined capacity of over 2 million barrels per day can be theoretically brought into play. The increased supply would end up being stored in facilities such as those in Fujairah, or in floating tankers. Barring any last-minute surprise deal being struck by the OPEC+ group or any subgroup or even US oil producers joining forces with OPEC+, the global supply glut will in all likelihood worsen.

    Plunge, an indicator of dire circumstances
    Prior to the week of March 6, oil prices were already under pressure as the Covid-19 virus spread, taking over 50 countries in its fold and showing no signs of abating. This evoked restrictions on travel, both international as well as domestic travel in certain countries such as China (province of Hubei) and Italy (northern region in particular). The restrictions, either imposed by governments or self-imposed by corporates and individuals, would mean lower demand for transportation and thereby fuel. The oil market had been closely watching the developments, trying to ascertain to what extent economic activity would be affected and for how long, as this would help assess when demand was likely to recover.

    Even before any sign of recovery could appear, on Friday, March 6, oil prices started to fall, reflecting the impact of the OPEC+ group’s decision to not extend production cuts. Prices took further beating as Saudi Arabia decided to offer discounts to the range of USD 3–7 per barrel for various customers, besides rapidly increasing production, reaffirming its strategy to expand market share at any cost. Overall, the coronavirus spreading and OPEC+ talks failing delivered a ‘1-2’ knockout punch to the oil market, sending prices in a free fall.

    Implications for GCC countries
    All eyes will be on Saudi Arabia, which has acted decisively after the failure of OPEC+ talks, given its strategy. The favorable geological nature of reserves (shallow and easily extractable) also means that Saudi Arabia can increase production fairly quickly, flooding the market if it desires. This, coupled with its lowest cost of incremental production, would imply that Saudi Arabia stands to benefit the most if it is able to lock-in sale of incremental production. Nonetheless, the strategy would disturb its budget math for 2020. It could lead to lower-than-expected oil revenues and a wider fiscal deficit, unless KSA decides to curtail expenditure and risk another economic slowdown, similar to the one in 2017. With its large forex reserves, Saudi Arabia also has the capacity to pursue this strategy for a longer period than some of its GCC neighbors. The extent to which Saudi Arabia will be affected would be determined by the volumes being sold and how low oil prices may go; arriving at a reasonable estimate is, therefore, quite difficult. All eyes will now be on the Q2 2020 budget statement (since Q1 2020 had two months of stable production and oil prices) report to assess the extent of damage. Consequently, we may see credit rating agencies putting Saudi Arabia’s rating on review or revising it downward.

    Rest of the GCC countries would undoubtedly be dragged into the imbroglio with no control over the outcome. Some of them like Bahrain and Oman are also fiscally vulnerable and any substantial fall in oil prices would bring their sovereign credit ratings on the radar of ratings agencies. For Qatar, a major producer of oil, prospects have been dwindling already due to the fall in gas prices that predated the decline in oil prices.

    GCC markets, both equity and fixed income, already reacted to the developments on Sunday, March 8 (GCC markets function Sunday to Thursday). Aramco stock fell below its recent IPO price. The Saudi Arabian primary market, which was warming up after Aramco IPO that reintroduced Saudi Arabia to the global investment community, would definitely be impacted by the sentiment. On the fixed income side, spreads for new issuances will widen. CDS spreads for GCC countries have already widened and 10-year sovereign bond yields have worsened as a knee-jerk reaction.

    Will Russia rue its decision to walk away from the OPEC+ group?
    Russia, portrayed by the media as the perpetrator of the failure of talks to extend production cuts, may have to take a relook at its decision. If it is unable to increase volumes (due to weak demand following the virus epidemic that shows no signs of peaking yet), and worse, if it loses customers to Saudi Arabia or any other producer, the lower oil prices would hit its foreign income and worsen the fiscal situation. Russian equities, which did well in 2019 would suffer in the near term. However, the economy has withstood several rounds of sanctions over the years. Hence, it is uncertain to what extent the latest development would affect the economic sentiment vis-à-vis that in other producers.

    US shale oil producers to take the highest impact
    The US shale oil industry flourished in the last couple of decades as increase in production, made possible by technologies such as fracking and horizontal drilling, catapulted the US to the top position in oil production (on monthly basis) in 2019. However, growth was based on substantial leverage on balance sheets backed by oil reserves valued on the basis of oil prices and benefits arising from the low rate environment. Large portions of outstanding debt (up to USD 86 billion) are reported to be due for refinancing over the next four years until 2024, as per Moody’s. The dominance of oil producers in the high yield debt market can be gauged by the share of the energy sector (~11%) in high yield bond ETFs.

    Low prices may not majorly impact producers in 2020 as prices would be locked in using options (similar to the scenario in 2015, when oil prices first crashed from USD 100 per barrel levels). However, the longer the low price environment prevails in 2020 and beyond, the more difficult it would be for oil producers to generate enough cashflows to service debt; this would increase the number of bankruptcies. Similarly, volumes in the high yield credit market would be impacted, as shale oil producers face challenges in refinancing debt with value of reserves declining amid lower oil prices.

    The impact is bound to be felt on shale oil & gas sector, a booming segment of the US economy. The oil & gas sector has been driving the economies of states such as Texas, and consistently contributing to new job additions. Listed oil & gas companies alone are reported to employ 700,000 people, with many more being employed directly by unlisted companies and several indirectly dependent on the sector. While the US economy and employment market is large enough to withstand the slowdown in one sector, it would invariably be a drag on consumption and employment in the long term.

    Likely beneficiaries – emerging market consumers and industries
    The countries that stand to benefit the most from the fall in oil price are major oil importers, such as India and China, whose import bills would decline. India, where domestic fuel prices are linked to international prices, the imported fuel price inflation component would decrease, resulting in better margins for companies having fuel as one of its major costs. However, it is uncertain if the decline in fuel prices will be enough to offset the subdued sentiment among consumers and corporates affected by structural and cyclical factors of slowdown. Even for industries such as airlines that have incurred substantial losses due to travel restrictions on account of Covid-19, the lower aviation fuel costs would only provide a partial relief.

    Conclusion
    The events between March 6 and 7 may have a far reaching impact on the main stakeholders – oil producers and their economies. Various parties may be affected in varying degrees. In some, such as oil markets, GCC equity and fixed income markets, as well as US high yield market, the result will be immediate. On the other hand, for GCC economies, Russia and US shale oil producers, the effects would become clear over long term. The immediate positive impact, however, would be if producers return to the negotiating table now that markets have reacted sharply to the developments.


  69. Is the US economy heading toward a significant market correction?

    The US markets suffered its worst week in over a decade as investors went into panic mode with

      to read | words

    The US markets suffered its worst week in over a decade as investors went into panic mode with the S&P 500 losing almost 11.5% in a week, rapidly wiping out nearly a year’s worth of steady gains. With the longest ever 128-month expansion, investors are skeptical about a significant market correction in the short term. Moreover, the impact of coronavirus may weaken the Chinese economy and, in turn, US and other markets. Though economic indicators, such as the yield curve inversion and PMI data, provide substantial evidence for a correction, valuations remain on the higher side.

    There have been mixed signals from the US economy and markets about the likelihood of a recession on the horizon. According to the National Bureau of Economic Research, following the global financial crisis, the US economic recovery and expansion made history in July 2019 by breaking the previous run during the dotcom bubble between March 1991 and March 2001 for a period of almost 120 months. With the longest ever 128-month expansion, all eyes are on the clock to see just how long the current expansion can keep going.

    The year 2019 became the best period for return generation and wealth creation across asset classes, with the S&P 500 soaring to new highs and returning close to 28%.

    Expansion/Contraction Months

    Source: National Bureau of Economic Research
    Year represents the start year for the cycle

    With the markets currently in unchartered territory, let us look at factors that might hint at a chance of a significant market correction in the near term.

    1. US Treasury Yield Spreads
      An inverted yield curve occurs when the yields on bonds with a shorter duration are higher than those on bonds having a longer duration. Yield curve inversion is a leading indicator of economic downturn and has successfully signaled recessions for the last 50 years. As per a Credit Suisse report, the economic downturn can happen anywhere between 14 and 34 months after yield curve inversion.

      Yield curve inversion is among the most consistent recession indicators, but other supporting metrics can give a better sense of its potential impact.

      10yr and 1yr US Treasury Yield Spread

      Source: Thomson Eikon

      On the basis of historical data, the significance of an inverted yield curve in predicting recession cannot be ruled out. The Treasury yield curve inverted before the recessions of 1992, 2002, and 2008, and now the yield spreads for 1-year and 10-year US Treasury turned negative in August 2019. Therefore, taking this analogy into consideration, we can expect a significant downturn in the short term.

    2. US Jobless Claims
      Jobless claims are a rough measure of how many people are losing their jobs. With claims at the lowest levels in 50 years and hovering around the 200,000 mark, the US economy has seen a record improvement in employment levels.

      Jobless Claims in 000'

      Source: Thomson Eikon

      Historically, unemployment claims reach their minimum and begin trending upward prior to the beginning of recession. Since recessions are associated with reductions in output, and as a result, in job severances, economists consider a sudden surge in jobless claims to be extremely relevant to an economic downturn.

      The initial jobless claims tend to reach a trough several months before economic recession, and when it begins, the indicator rises sharply. For example, the unemployment rate reached its lowest level prior to the outbreak of the global financial crisis in May 2007, seven months before the official commencement of the recession, and earlier in April 2000, eleven months before the 2001 recession.

      As of the end of February 2020, jobless claims were still in a downward trend, so this data series is positive and does not indicate an upcoming recession yet.

    3. US Manufacturing Purchasing Managers’ Index
      The US Manufacturing Purchasing Managers’ Index (PMI) is a diffusion index incorporating survey results provided by manufacturing firms throughout the country. A reading above 50 suggests the manufacturing sector is expanding, while a reading below 50 suggests the manufacturing sector is contracting.

      The PMI is an extremely important indicator for international investors seeking to form an opinion on economic growth. Many investors use it as a leading indicator of economic growth or decline. Central banks also factor in the results of PMI surveys when formulating monetary policy.

      US PMI Data

      Source: Investing.com

      The US PMI was down toward the end of 2019 and has been at its lowest since the 2008 global financial crisis. While the US manufacturing sector indicates evident contraction, jobless claims show signs of factories suffering from a global slowdown even though employment remains healthy. This can be partly attributed to the trade war between the US and China. In addition, markets have started to feel the pinch from the coronavirus impact, which may cause further contraction in the manufacturing sector.

      A decline in China’s growth presents outsized risk for global economies and markets. As per a report by Deutsche Bank, China represents approximately 15% of global GDP and total global oil demand and accounts for over 30% of global GDP growth and global oil demand growth. The US economy largely depends on the Chinese economy, with 20% of its imports coming from China. Therefore, any supply-side shock will have a negative impact on the US economy.

    4. S&P 500 Valuations
      US markets had a dream run after the global financial crisis of 2008 and have grown close to 4.5x in a decade’s time. Markets have remained buoyant with the longest ever 128-month expansion, and a correction in the near term could bring valuations significantly lower and provide investors an opportunity to buy.

      S&P 500

      Source: Thomson Eikon

      The US markets had expanded from 1996 to 2000, but this expansion was followed by the dotcom bubble burst in 2000, with the markets correcting by almost 40%. Thereafter, confidence started picking up again, with the markets rebounding to 2000 highs until 2008. During the global financial crisis, the markets corrected by more than 50% and the price/earnings (P/E) ratio reached the lowest level to 9.2x, thereby providing a golden opportunity to investors.

      With the S&P 500 at around 3,000 at present, let us look at the historical multiple range:

      Ranges are calculated from data for 1996–2019

      On the basis of data gathered for the last 23 years, we have classified data points in the range of the P/E ratio and calculated the possible returns one could have made by investing in these ranges, along with the average price/book ratio and dividend yield. A detailed summary of this data is provided below.

      P/E Range

      Avg 3-yr Return

      Min 3-yr Return

      Max 3-yr Return

      Avg Price/Book

      Avg Div Yield

      9–11

      57.16%

      30.53%

      102.63%

      1.62x

      3.62%

      11–13

      54.25%

      10.23%

      79.03%

      1.82x

      3.09%

      13–15

      50.89%

      -6.42%

      73.69%

      2.07x

      2.63%

      15–17

      12.18%

      -46.82%

      60.05%

      2.47x

      2.36%

      17–19

      19.03%

      -46.55%

      59.36%

      2.70x

      2.26%

      19–21

      28.97%

      -5.89%

      47.63%

      2.90x

      2.27%

      21–23

      16.35%

      -13.39%

      37.68%

      3.17x

      2.12%

      23–25

      3.07%

      -23.01%

      22.77%

      3.58x

      1.75%

      25–27

      -16.83%

      -37.11%

      12.22%

      4.52x

      1.51%

      27–29

      -29.33%

      -42.45%

      -1.95%

      5.11x

      1.49%

      29–31

      -27.15%

      -43.42%

      -8.97%

      5.23x

      1.36%

      31–33

      -22.07%

      -39.77%

      -8.99%

      5.45x

      1.15%

      33–35

      -16.94%

      -18.23%

      -15.39%

      5.70x

      1.08%

      Values are calculated from data for 1996–2019

      Historically, investors make decent returns by investing in stocks when P/E values upto 20x and outperform fixed income returns. Investors can expect exceptional returns of more than 50% in three years with a P/E ratio of up to 15x. One such golden opportunity was when the P/E ratio was ~9x in 2008. Not considering stock-specific investments, the overall markets had returned nearly 103% in just three years’ time.

      Whenever there is a dividend yield and price/book crossover, markets have provided investors decent returns.

      Taking into account the information presented above, let us see where the index stands today and what to expect next. Considering that the S&P 500 currently has a P/E ratio of almost 21x, we have summarized the relevant data below.

      P/E Range

      Avg 3-yr Return

      Min 3-yr Return

      Max 3-yr Return

      Avg Price/Book

      Avg Div Yield

      21–23

      16.35%

      -13.39%

      37.68%

      3.17x

      2.12%

      23–25

      3.07%

      -23.01%

      22.77%

      3.58x

      1.75%

    Conclusion
    To sum up, the yield curve inversion and US PMI data strongly indicate that markets are going to head south in the near term. Investors should closely monitor jobless claims and PMI data to gauge the economic prospects. Moreover, the valuations are not sufficiently enticing for investors to generate outstanding returns in the coming future. Any further developments on the coronavirus impact or US-China trade war should be consistently monitored.

    If the US economy goes into a downturn, the global economy will also begin to spiral down.


  70. GCC 2020 expansionary budgets under threat from oil price slump due to Covid-19 spread

    Oil prices have been declining over the past two months following the outbreak of coronavirus in Wuhan, China,

      to read | words

    Oil prices have been declining over the past two months following the outbreak of coronavirus in Wuhan, China, which is now spreading globally. The spreading of the disease is expected to have a substantial effect on global GDP and oil prices. The persistent weakness in oil prices is worrisome mainly for the GCC region as oil is the major source of revenue. Gulf countries have already announced their budgets for 2020, assuming oil price at USD55–60 per barrel. With oil prices currently way below the GCC governments’ estimation, the deficits of these countries could widen toward the end of 2020. However, the constant efforts of GCC countries to diversify their economy towards the non-oil sector over the past many years would provide some cushion in this challenging environment.

    Crude oil prices have fallen since January 2020 as the news of coronavirus spreading widely came in. Measures taken by OPEC and allies to rebalance the market by extending production cuts did little to arrest the decline in prices and therefore, these oil exporting countries are planning for further production cuts. The correlation is quite straight—China and other countries in Asia-Pacific are among the largest consumers of oil; any slowdown in economic activity (factories shutdown, curbs on transportation) would dent demand. The direct impact of persistent low oil prices would be evident on the budgets of GCC countries that were based on an anticipated price range of USD55–65 per barrel when prepared in Q4 2019. The reserves as well as strategies to absorb wider deficits resulting from lower oil revenues differ from country to country in the GCC region; some may be compelled to curtail expenditure. The silver lining is the ongoing push to diversify from oil through initiatives to boost non-oil sectors coupled with the reforms implemented over the past few years to curb wasteful expenditure and subsidies.

    Sustained weakness in oil prices to widen GCC budget deficit
    GCC countries’ budgets are directly corelated with oil prices as oil accounts for about 60–80% of total revenue. Most GCC countries had announced their budgets for 2020 when prices were hovering at USD56–60 per barrel. However, the outbreak of coronavirus in China has caused oil prices to plunge, falling about 11.1% MoM in February to USD51.1/barrel.

    Exihibit:1 Oil price forecast vs GCC budget oil assumption

    Source: media article, ministry of finance

    Currently, oil price future is trading in the range of USD49–53 barrel for 2020. The epidemic is expected to have an indirect but substantial impact on GDP growth in the GCC region and, therefore, its budget. With oil prices way below the estimation of GCC governments, the deficit in these countries is expected to widen further in 2020. To plug the gap, the region either needs to increase debt borrowings and/or introduce various taxes. GCC economies may also have to curtail their expansionary budgets to reduce the pressure on the overall region’s budget. Based on the IMF’s data for October 2019, Saudi Arabia’s gross debt to GDP was about 23.1% for 2019E, while that of the UAE and Kuwait was about 20.1% and 15.2%, respectively, indicating room for increase in debt. However, gross debt to GDP was relatively higher for Oman (59.9%) and Qatar (53.1%).

    Diversification to non-oil sector likely to provide some respite
    Most GCC countries have been working relentlessly to diversify their economy over the past many years as persistent weakness in oil prices has impacted their revenues. Despite diversification resulting in wider budget deficits, the countries have pursued it as they look to hedge against the volatility in oil markets globally. In line with the objective, Saudi Arabia has introduced Vision 2030, while the UAE implemented Vision 2021. Oman launched Vision 2040, while Qatar and Kuwait implemented Vision 2030 and Vision 2035, respectively. Although economic diversification is a complex and long-drawn process, in the long term, it is expected to trim the budget deficit by providing a cushion against the uncertainties in global oil markets.

    The chart below depicts the increasing contribution of non-oil revenue which is only expected to grow, going forward. We have not given the non-oil revenue percentage for the UAE due to availability of limited information. However, as per the UAE’s Minister of Economy, the sector accounts for 70% of its GDP. Sectoral contribution has increased 14% in the last four years and the government aims to take it to 80% by 2021.

    Exhibit 2: Increase in non-oil revenue percentage

    Source: media article, ministry of finance

    Highlights of 2020 budget
    GCC countries have presented expansionary budgets for 2020. KSA announced the second highest budget on record, while the UAE announced its largest budget since the time the country has been established. Qatar declared its biggest budget in the last five years.

    Most GCC countries are expected to report higher deficit or lower surplus for 2020 vis-à-vis 2019, considering the anticipated lower oil revenues. More importantly, they are expecting more revenue from non-oil sectors.

    Exhibit 3: Deficit to widen for most GCC countries (USD bn)

    Source: Media article, Ministry of Finance;* fiscal year 20-21


    Conclusion
    The fall in oil prices over the first two months of 2020 has disturbed the budgetary calculations of GCC countries that prepared their budgets for 2020 in Q4 2019 on an anticipated price range of USD55–65 per barrel. This may lead some to take a relook at their expenditure plans or raise more debt. Despite the predicament the decline in oil prices has created, GCC countries remain committed to economic diversification and have accordingly allocated funds to boost growth. The budgets are based on a strategic approach similar to that adopted for 2019—prudent increase in expenditure targets. Although sustained weakness and volatility in oil prices would continue to pose challenges to the 2020 budgets of GCC countries, strategic steps to diversify the economy (such as introduction of various taxes and promotion of private-public partnership) would support employment and social development in the near term.


  71. The Looming Pension Fund Shortfall - Are Future Retirees at Risk?

    The major shift in demographics with increasing life expectancy is expected to create problems for future retirees, who

      to read | words

    The major shift in demographics with increasing life expectancy is expected to create problems for future retirees, who are expected to outlive their savings. In economies where the population is aging rapidly, one of the key challenges is to provide financial security for the older population. Most economies concentrate their pension fund assets in conventional investments markets – equities and bonds – thereby, depending largely on markets that are volatile and dynamic. This warrants a more cautious and planned approach by fund managers entailing diversification of pension funds from low-risk, low-return to high-risk, high-return asset classes. Moreover, at an individual level, a more prudent approach is required in terms of planning investments and increasing savings.

    The global population is aging at an increasing pace. As per a United Nations report, the number of elderly is estimated to surpass that of children under 10 years old by 2030, and reach 2.1 billion by 2050. The incidence of aging is more pronounced in North America and Europe (more than 1 in 5 persons aged 60 or above in 2017). Aging in itself is accompanied with a lot of challenges; one of the main effects is on the financial security of the older population, so far ensured by company pension plans and government pension funds. Amid the growing population of retirees, pension plans are falling short.

    Many companies are unable to handle their pension obligations, such as corporate giant General Electric (GE). The company was forced to offer pension buyout to former employees. The company also had to freeze the pension plans of over 20,000 salaried employees in the US. Conglomerates such as Federal Express, Verizon and General Motors were also compelled to take this harsh step. In a significant development, Dean Foods, the largest milk producer in the US, filed for bankruptcy in December 2019 due to high debt and increasing pension obligations. Shortly after, in January 2020, the second largest producer, Borden Dairy Co., filed for bankruptcy, citing inability to meet debt and pension obligations.

    Government pension plans too are afflicted with a widening gap between assets and pension liabilities. National governments in most countries have schemes for their ageing population to provide them with an income in their golden years. However, these plans are largely skewed toward traditional assets that have a low-risk and low-return profile. As longevity increases amid improvements in healthcare and lifestyles, the drawdown period is becoming longer, requiring a larger pool of assets to provide from. On the other hand, as a larger portion of workforce enters the retirement age, their contributions to pension plans stop, while the drawdown starts.

    Governments across nations are looking at various options to tackle this issue. For example, to reduce the pressure on pension plans, the Government of France proposed increasing the retirement age. However, this was not received well by its citizens, resulting in protests countrywide. Hence, governments need to tread carefully and judiciously weigh the likely reaction from the public.

    Government social welfare plans and company-defined benefit pension plans are under pressure globally. The countries listed below witnessed an overall retirement savings gap of US$70 trillion in 2015 (as per last available data). If corrective measures are not taken to increase savings, the gap is expected to widen to US$400 trillion by 2050.

    Figure 1: Size of retirement savings gap (US$ trillions)

    Size of retirement savings gap (US$ trillions)

    Source: Mercer Analysis for World Economic Forum

    Pension systems world over are different. For example, in the US, the system comprises social security, employer-provided pension, and personal retirement savings. There are contribution plans such as 401(k), under which employees can choose their retirement investment. This plan does not have any maximum or minimum guarantee benefits.

    One of the reasons for the current crisis is the lack of individual savings and investment and complete dependence on pension plans. There are other factors too. For example, in the US, four factors affect pension fund balances. First, many people in their 60s currently did not have access to 401(k) accounts at the start of their career. Therefore, their accumulation would be lesser compared to of a younger set of employees. Second, due to the lack of universal coverage, a worker may have been in previous jobs that did not have retirement plans. Third, since participants can access their account before retirement, at times accumulations leak out. Fourth, the fees charged depending on the size of the plan can significantly impact the net return on investments.

    A few pension plans offered by countries are listed below.

    Figure 2: Coverage offered by countries

    Country

    Coverage offered comprises of

    Denmark

    A basic public pension scheme; an additional pension benefit scheme; defined contribution scheme (fully funded); and compulsory occupational schemes

    The Netherlands

    A public pension scheme (flat rate), and quasi-mandatory pension scheme (earnings-related); majority of employees are part of these occupational schemes which consist of defined benefit plans industry-wide and where earnings are based on average earnings over the lifetime

    The US

    A social security system based on earnings over the lifetime, together with a top-up benefit; and voluntary private pension plans (either occupational or personal)

    China

    An urban system and a rural social system characterized by pay-as-you-go pension plan, which includes employer contributions in a pooled account and employee contributions in funded individual accounts; and additional plans provided by some employers in urban areas

    Japan

    A flat-rate basic pension scheme; pension based on earnings; and voluntary pension plans that are supplementary in nature

    India

    An employee pension scheme (earnings-related); a defined contribution employee provident fund; additional pension schemes (managed by employers) which are majorly defined contribution plans; also, government schemes introduced as part of universal social security program

    Source: Melbourne Mercer Global Pension Index 2019

    Is suppressing fixed income returns/yields worsening the pension shortfalls?
    Traditional pension plans invest in bond markets, a relatively safe bet. With lower interest rates, yields on bonds decline, resulting in lower return on investment.

    The US Federal Reserve hiked the interest rate in December 2015, after keeping it at near-zero levels for nearly a decade. The situation changed dramatically in 2018 when the interest rate was increased four times. In 2019, the Federal Reserve cut interest rates three times. After the rate cut in October 2019, the fed funds rate was in the range of 1.5–1.75%. This entire exercise in 2019 was to ensure that growth in the country continued, as 2020 is the crucial election year.

    Figure 3: Fed interest rate cycle

    Fed interest rate cycle

    Source: Reuters Eikon

    The yield curve, which is now un-inverted, had inverted in August 2019, implying short-term yields were higher than long-term yields. Consequently, markets became cautious as inversions have occurred prior to each recession in the US in the past 50 years. As pension funds tend to invest in low-risk, less dynamic, long-term instruments, an inverted yield curve and low interest rate do not bode well for fund managers.

    Figure 4: Difference between 2-year and 10-year treasury yields (basis points)

    Difference between 2-year and 10-year treasury yields (basis points)

    Source: US Department of the Treasury

    Importance of right mix of asset allocation
    Fund managers need to tread more warily in terms of asset allocation, given the volatility in markets and everchanging economic conditions.

    The proportion of equities in pension fund investments increased from 17.9% in 2008 to 24.4% in 2018, while that of bonds declined from 51.5% to 44.9%. Changes in asset mix are mainly due to a change in investment and asset allocation strategy. In 2018, almost 70% of pension fund assets were invested in equities, bonds and bills. Thus, any change in equity and bond markets can significantly affect the return on pension fund investments.

    Figure 5: Asset allocation of pension funds in selected investment categories in 2008 and 2018

    A. 2008

    Over 29 reporting OECD jurisdictions

    A. 2008

    B. 2018

    Over 36 reporting OECD jurisdictions

    B. 2018

    Source: OECD Global Pension Statistics October 2019

    Suggestions to improve condition and conclusion
    Market conditions are not always promising and, therefore, there is no guarantee of returns. This could create uncertainties for future retirees. However, a few steps can be taken to address the challenge.

    At the investment level, fund managers must diversify the asset portfolio and take calibrated risk. This is needed to maximize returns on pension funds which are sinking fast. Although these investments usually have a low risk appetite, the need of the hour is to diversify and enter high-risk, high-return asset classes. Allocation of funds needs to change, and this calls for in-depth research on asset classes and scrutiny of the portfolio. Methods such as factor allocation and attribution analysis can be employed to scrutinize the portfolio and conduct thorough analysis.

    At a personal level, individuals can increase their wealth through savings and prudent investment decision during their working years.

    The issue needs to be tackled from multiple angles to ensure a secure future for retirees.


  72. Micro mobility in the fast lane – addressing the first and last mile commute

    The rising concern on environmental degradation has led to various solutions to reduce our carbon footprints. This business

      to read | words

    The rising concern on environmental degradation has led to various solutions to reduce our carbon footprints. This business model, which involves shared use fleets of small e- vehicles has recently attracted a lot of attention, due to investments flooding it. The conducive environment has allowed this model to flourish and the futuristic outlook of its market is also positive.

    Introduction to the micro mobility landscape
    Shared Micro mobility is the concept that has shared-use fleets of small, fully or partially human-powered vehicles such as bikes, e-bikes, and e-scooters.

    Micro mobility is currently experiencing a rampant growth. Its increasing popularity and rapid adoption is due to the need for renewal energy as well as the inclination of Gen Z and Millennials towards resource sharing. This business model has bought a widespread change in the transportation landscape.

    Buoyed by increased adoption, the micro mobility concept has attracted the attention of PE/VC investors. It is estimated that micro mobility companies have globally raised US$8.3bn in the last 5 years ending 2019.

    Efficient, cost effective and environment friendly
    Micro mobility has the potential to deliver significant benefits to the consumers, such as efficient and cost-effective travel, reduced traffic congestion, and decreased emissions.

    Studies suggests bikes are faster and cheaper: The New York City Department of Transportation’s mobility report suggests that the Citi Bike riders in New York travel ~30% faster than people in taxis. For example, a travel trip of 1.5 miles took 15.7 minutes in a taxi while it just took 10.8 minutes on a bike. The taxi trip cost more than US$ 10.6, where as a bike rides cost around US$ 1.57. Hence, the bike rider is lighter on the pocket and easier on the planet!

    Time consumed and money spent comparison

    Source: The New York City Department of Transportation’s mobility report

    Environment friendly: According to Lime bikes, every mile travelled produce ~350 grams of carbon. Therefore, if people were to switch from driving cars to riding a bike for short trips, between 2.4-5.0 billion gallons of gas could be saved each year. That's the equivalent to 45 million tons of less CO2 in the atmosphere.

    A research suggests that one kilowatt hour of energy allows a normal car to complete three laps of a football field or ~1.29km, an electric vehicle can complete 17 laps or 6.6km and an e-scooter can complete 333 laps or 133km of distance.

    It is estimated that around 60% of the journeys made by a US citizen is between 0-5 miles. We believe this high proportion of short distance trips makes micro mobility one of the most favorable option to commute.

    Micro mobility resonates well for customer travelling between 0-5 miles

    Micro mobility resonates well for customer travelling between 0-5 miles

    Source: Barclays, US National Household Travel Survey

    The above premise is supported by the fact that in 2018, people took 84 million trips on Shared micro mobility in the United States, more than double the number of trips taken in 2017.

    Trips taken on shared bikes and scooters across the U.S

    Source: National Association of City Transportation Officials
    Note: Total trips taken in Mn in 2018

    Market potential for micro mobility
    Mckinsey suggest that the market potential for micro mobility could comprise between 8-15% of trips under 5 miles and grow to US$ 200bn to US$ 300bn (low and high estimates) in the U.S. by 2030.

    The passenger trips of less than 5 mile accounts for as much as 60% of passenger miles traveled in the U.S., however accounting for number of constraints such as adoption, weather, ability (age and fitness) to ride it is expected to conservatively capture only 8-10% of the trips.

    Benefits of micro mobility

    Easing up traffic and parking problems
    Micro mobility is expected to ease land demand and consequently open land supply. In a competitive market, this would lead to moderation in the land prices, and decrease in housing prices. Currently local governments across the world have started banning select vehicles from city centers.

    The new and greener way of transportation
    More and more Gen Z and Millennials are becoming conscious about their carbon footprints on the plant. Shared micro mobility presents an opportunity to cut down carbon emissions by replacing the first and last mile transport in the urban areas.

    Expansion of the Market
    Micro mobility market has witnessed a stellar expansion over the past two years. With three e-scooter players establishing business in 1H of 2018 and growing inorganic interest from ride sharing titans, Uber and Lyft. While regulations pose a roadblock to the adoption of micro mobility, the continued expansion of the industry is irrefutable.

    Micro mobility market attracting capital investment
    Micro mobility has attracted continuous attention as PE/VC investors garnering more than US$8.3bn investment in the last five years ending 2019. While the astronomical growth in the funding activity has slowed down in 2019, we believe there is huge investment opportunity in early stage micro mobility companies as regulatory visibility improves.

    Capital raised by micro mobility companies in US$bn

    Source: Pitchbook, S&P Capital IQ, Aranca Research

    The rise in micro-mobility has been driven by significant funding in the early entrant players Hellobike, Lime, Ofo, Bird, and Mobike, as well as a number of acquisitions/investments from larger players such as Meituan, Uber and Lyft.

    Select micro-mobility companies, by capital raised

    Company Name

    Capital Raised in mn

    Location

    Company Description

    Hellobike

    US$1,640

    China

    Operates a bike sharing platform designed to create an intelligent urban traffic system

    Ofo

    US$1,620

    China

    Developed a bike sharing platform designed to offer an efficient ride in the fast-paced city

    Mobike

    US$832

    China

    Provides a bike sharing platform in China designed to allow users to locate nearby bikes

    Lime

    US$777

    United States

    Developed a bike sharing platform designed to change the way people travel within blocks

    Gogoro

    US$480

    Taiwan

    Developed an electric scooter that utilizes rechargeable smart batteries

    Bird

    US$268

    US

    Provides citizens with access to shared personal electric vehicles that can be picked up and dropped off anywhere

    Source: Pitchbook, S&P Capital IQ, Aranca Research

    Final thoughts
    While operational challenges such as travel speed, road safety issues, sensitivity to weather, parking related nuisance etc. will weigh on the sector growth, we believe accelerating adoption, continuous evolution of the sector in terms of design and business model is expected to attract strong growth and incremental investment.

    This concept is slowly disrupting the local transportation industry. Due to its manty benefits, growing customer base and efficiency, this sub – segment is growing in leaps and bounds.


  73. PE Firms Going Long on US Online Short-Term Rental Market

    The vacation rental homes industry has developed rapidly and is set for more growth. Due to the promise

      to read | words

    The vacation rental homes industry has developed rapidly and is set for more growth. Due to the promise it holds, the market has not only attracted venture capitalists but also witnessed an increase in mergers & acquisitions. This growth can be attributed to technological advancements and the market’s online nature, making it easy for travellers to choose, review and book. Hotel chains are also entering this space through either mergers or by creating smaller entities within to have a slice of the pie. Outlook for the industry remains positive and disruptive technologies will redefine the domain further.

    Rapid expansion of the sharing economy has ushered in transformation of the accommodation industry. One of the examples of sharing economy is short-term rental homes or vacation rental homes.

    A vacation rental is a short-term rental option provided as an alternative to hotels. It covers stay options, including villas, apartments, condos, apartments and private homes for travelers and tourists. The lodging units are offered on a nightly, weekly, or a monthly basis primarily on the weekly basis. Online vacation rental websites offer and manage these properties on behalf of owners. They act as a broker and do not own any of the real estate listings, nor do they host events. Major players in the market are Airbnb, HomeAway, and Wyndham Worldwide. Airbnb is leading the market followed by other players.

    The global vacation rental market is estimated to grow to $193.89 billion by 2021, recording a CAGR of 7.6%. The US vacation rental market, on a similar growth trajectory, is expected to register a CAGR of ~7.0%.

    The US market accounts for 23% of the global vacation rental market. Vacation rental users in the US increased from 27.5 million in 2017 to 31.9 million in 2019. The percentage of people over 18 who have stayed in a vacation rental has quadrupled from 8% to 32% in the past few years. There are more than 20,000 vacation rental properties in the US, representing just 20% of the global vacation rental properties.

    Vacation Rental Market ($ in billions)

    Source: Technavio

    Vacation Rental: Number of Users in the US (millions)

    Source: iPropertyManagement

    Top Reasons for Travelers to Choose Vacation Rentals over Traditional Lodging


    The US rental home industry is expected to continue growing at the current rate. Online expansion of the market has contributed to this growth. There is new-found demand, enabled by greater transparency in properties through online reviews and easy booking options. Rapid innovations and advancements are only adding to the industry’s appeal to investors.

    Trends and Drivers

    Expansion of online distribution
    Now a days, most travelers plan their outing destination, itinerary, transport and accommodation by browsing various travel websites and blogs; as a result, vacation planning is increasingly going online. Thus, while vacation rentals have been around for some time, increased internet penetration has unlocked a higher potential for growth and provided a global perspective. For instance, Airbnb has created a user-friendly interface that allows vacation rental owners to post their listings and renters to surf, check and book online. Apart from that, it offers services such as professional photographers, trust and safety managers, and security provisions to both owners and renters to simplify the entire process. This has significantly boosted growth in the market.

    Technological advancements
    The vacation rental market is growing aided by technological innovations. Property owners are continually investing in smart home devices to simplify the holiday rental process, while appealing to tech-savvy consumers at the same time. Artificial intelligence and data mining tools are being implemented for better decision-making. Revenue management software is used for optimum pricing of properties. Channel management tools, employed to match property content, prices, and availability, are contributing to increasing rental incomes.

    New entrants from related industries
    Lured by the strong growth in the vacation rental market, vendors are opting for the sharing economy model. The vacation rental market is still highly fragmented with few larger players and various smaller companies. Currently, hotels are also following the vacation rental market strategy and making it a viable income option. Even hotels and online travel agencies are marking their presence in short term rental space. For instance, Booking.com launched a new website, Villas.com, which provides vacation rental villas.

    Since the dynamics of hotel and rental industries differ, it is an essential step for companies operating in related industries, considering the disruption it has caused. Also, this trend could improve the overall experience associated with vacation rentals as these companies have been operating in the hospitality segment and are equipped with the know-how and skills required.

    Investments in Vacation Rental Market
    The rapid rate of growth has rendered the market highly lucrative. Major short-term rental players now offer more than a million listings each, and investments have been coming in.

    Vacation rental properties give guests an attractive and cost-effective travel avenue that differs significantly from hotel offers. Due to experience-related preferences, travelers have started choosing vacation rental over hotels.

    Considerable angel and institutional funding have been raised by startups in the past few years. In addition to primary services, huge investments are flowing into ancillary services.

    The vacation market is increasingly attracting capital due to its size and substantial opportunities. Investors are continuously investing capital in startups claiming to use technology to automate and improve vacation rental property management.

    Startups in the vacation rental space have raised more than $3.4 billion capital in the past decade. The industry recorded 750% growth in funding in 2016 compared to 2014. Most investments are in the online marketplace. With the rise in the number of travelers as well as vacation rental properties, investors are lured toward companies innovating in the vacation rental space.

    Investment in Turnkey Vacation Rentals shows that technology is the key to driving quality and efficiency in private home rental management. It secured $48 million in funding in July 2019, bringing the total capital raised until date to $120 million. Sonder, a vacation rental company in the US, recently raised $225 million to expand in the urban market. Startups and smaller companies are also following the example of larger companies such as Airbnb and Booking.com.

    To offset competition and increase presence across the globe, shared accommodations are even acquiring traditional lodging facilities. For instance, in May 2019, Airbnb acquired HotelTonight, a last-minute boutique hotel booking platform, to mark its presence beyond the vacation rental market. Currently, Airbnb alone is present in over 191 countries and has over 500 million guest arrivals.

    Amid the booming supply, fragmented market, and high margins, the hospitality sector has been a favored option for investors. With the success of Airbnb and Vrbo, private accommodation, once an underutilized aspect of online travel, has become popular and is attracting investors.

    The vacation rental market is attracting investments across all the segments

    Target/Issuer

    Amount ($mm)

    Type

    Investors

    Year

    Vacasa

    319.0

    Series C

    Multiple Investors

    Oct 2019

    Beyond Pricing Inc.

    42.5

    Series A

    Bessemer Venture Partners

    Sept 2019

    Wyndham Vacation Rentals North America

    166.0

    M&A

    Vacasa

    Jul 2019

    Sonder Corp.

    210.0

    Series D

    Multiple Investors

    May 2019

    OYO Vacation Homes

    202.0

    M&A

    Oravel Stays Private Limited

    May 2019

    Lyric

    160.0

    Series B

    Airbnb

    April 2019

    2nd Address

    10.0

    Series C

    GV (formerly Google Ventures)

    Feb 2019

    Vacasa

    64.0

    Series B

    Multiple Investors

    Oct 2018

    ILG, LLC

    5,824.1

    M&A

    Marriott Vacations Worldwide Corporation

    Apr 2018

    Source: Pitchbook, CapitalIQ and analyst reports.

    Investments in vacation rental mergers would continue in 2020 as well. 2020 seems to be an interesting year for the industry with planned IPO of Airbnb. As the industry grows and matures, property management companies are consolidating. The entry of new players in the market, like hotel chains partnering with or acquiring short-term rental businesses, also reflects the ongoing transition. Vacation rental technology companies are undergoing mergers and acquisitions as they look to expand market share, increase global reach and respond to new demand.

    As the industry matures and the line between hotels and vacation rentals blurs, their roles are getting intertwined, creating a shared space.

    The vacation rental market is gearing to enhance customer experience, more specifically providing five-star experiences. Needless to say, technology would play a big role in helping meet this objective.

    Amid the impressive growth, investments in the industry will continue and the outlook is positive. In its bid to remain competitive in the market, the industry will transform further, and rules would be redefined. Larger firms are acquiring new companies to access latest technological advancements in the industry. Hence, amid growth and competition, the appetite for investments in the vacation rental market seems strong for 2020 as well.


  74. Growing Competition in US Media Industry Driving Acquisitions

    The astronomical success of Netflix has disrupted the traditional entertainment market, luring tech players to the newly created

      to read | words

    The astronomical success of Netflix has disrupted the traditional entertainment market, luring tech players to the newly created SVOD segment and forcing incumbents to adapt. With content as the key differentiator, companies are either investing heavily in original content or acquiring traditional companies with popular existing content. Some companies are also using this opportunity to diversify or enter new segments through acquisitions. The past year has seen many major deals, including mega mergers such as Disney-Fox Corp and AT&T-Warner. The momentum is expected to continue as small media companies look to partnerships to boost scale or gain synergy.

    The US media and entertainment (M&E) industry, which includes movie studios, cable, satellite and other modes of entertainment, is the largest in the world, with a strong following globally. Worth $717 billion as of 2017, it is estimated to grow at a 2.4% CAGR to $825 billion by 2023 Competition in the media landscape is intense due to technological improvements, increasing internet speed and rising internet penetration driving demand for video content. With content increasingly being delivered over the Internet, companies are no longer required to invest in proprietary infrastructure (such as cable network or satellites) to reach customers. This has enabled startups and tech companies with deep pockets to enter the space and seek a share in the growing Subscriber Video on Demand (SVOD) market. The traditional business model of ad supported entertainment is declining rapidly; this is reflected in the 2.2% fall in TV ad spending in 2019, compelling companies to look for new revenue streams. The fast changing scenario has created a fertile ground for mergers as companies try to adapt to the new digital business model.

    Factors Leading to Consolidation

    Streaming effect

    Subscriber video on demand has taken consumers by storm─74% of households in the US currently have an SVOD service, while its subscriber base surpassed the cable subscriber base for the first time in 2017. SVOD is cheaper than cable network and major providers are investing heavily in content; this is encouraging consumers to cut the cord with other modes.

    Figure 1 SVOD Penetration in US Households (% of Households with SVOD)

    Source: Marketingcharts

    The success of SVOD has piqued the interest of both traditional media companies, such as Disney, as well as non-media companies like telecom and tech players. For non-media companies, SVOD can serve as a differentiator, a means of acquiring and retaining customers. It can also help in creating an ecosystem of products/services, wherein SVOD services could be bundled with device offerings. Amazon and Apple are specifically using SVOD as a means of creating an additional subscriber revenue stream and to lure customers. Two years after completing its acquisition of Warner, AT&T is now planning to launch wireless packs with HBO Max bundles to drive subscriptions; this is similar to what its rivals Verizon and Comcast are doing with Disney+ and Netflix, respectively.

    Content is King

    An SVOD service provider needs to have a quality catalogue of content to attract as well as retain customers. While the traditional cable business allowed content creators to both host and license their content to other broadcasters, SVOD as a differentiation necessitates that creators hoard both their IP and content. Netflix learned this the hard way when Disney pulled out the Marvel IP from their platform. The battle for content has resulted in companies pledging huge amounts of money for both quality and original content.

    Figure 2 Estimated Non-Sports Video Programming Expense of Select Companies in 2019

    Source: Moffett Nathanson, Company Reports

    Many of Disney’s recent mergers were guided by the need to create a catalogue of popular content for their Disney+ service. One of the rationales behind the Viacom-CBS merger was to create a company with a strong content portfolio and capable of competing with the likes of Netflix and Disney.

    Transforming Businesses by Building Scale and Diversifying

    Acquisitions enable companies to explore new revenue streams or synergies by entering new segments. With the lowering of entry cost and amid growing competition in the industry, media companies need to build enough scale so as to be able to undertake the desired expenditure on content, besides directly interacting with the customer.

    Disney’s acquisition of Fox not only gave it a powerful catalogue of content but also facilitated its transformation into an end-to-end media behemoth. Disney had multiple high-quality studios to produce content as well as channels and streaming services to distribute to consumers. This size alone gives it enormous bargaining power over media stakeholders from cinema owners to advertisers. By acquiring Fox, Disney also gained control over Hulu, which it is bundling with Disney+ to attract more customers.

    Viacom and CBS are joining hands to gain the requisite scale for investing in streaming assets and competing in a highly crowded market. However, unlike Disney, instead of keeping their content exclusive, the merged entity is planning to license its content to other streaming services as an additional source of revenue. This is a bold move since allowing other SVOD services to host their content could dent their own service’s value proposition as well as subscriber base.

    For telecom companies like AT&T, acquisition of media companies provides access to content, besides building synergies in the form of wireless plans bundled with video subscription. The repeal of net neutrality will also allow telecom companies to favor their own services through higher data caps and bandwidths, compared to rival services. The ability to control internet backbone will give telecom companies negotiating power during licensing agreements

    Deals Galore
    The year 2017 was a landmark for the M&E industry ─ a high number of deals were signed, including major ones such as Disney-Fox Corp which significantly impacted the industry. 2019 ended on a marginally higher note compared to 2018 and includes two significant deals, Viacom-CBS and SBG-Fox Networks deal.

    Most acquisitions have been in the movie and entertainment segment, followed by broadcasting. Cable and satellite is a mature industry and highly concentrated with a few players such as AT&T, DirectTV and Comcast dominating the market; this explains the lack of transactions in this segment.

    Figure 3 Transactions in US Media and Entertainment Industry

    Source: S&P Capital IQ

    Movies and broadcasting dominated the M&A space with blockbuster deals – AT&T acquired Warner, while Disney acquired Fox Corp. Disney-Fox Corp is the biggest transaction over the last few years, 4x larger in size than the next biggest transaction which is the Viacom-CBS deal. The Sinclair deal was the only notable one in the cable and satellite segment.

    Figure 4 Major Transactions in Industry

    Source: S&P Capital IQ


    Figure 5 Total Transaction Value in US Media and Entertainment Industry (USD bn)

    Source: S&P Capital IQ
    Note: Excludes Disney-Fox and AT&T-Warner due to size of these transactions

    Transaction value grew 53% between 2016 and 2017 but has been more or less steady over the past few years. Deal activity was strong in broadcasting in 2017 and 2018, but slowed in 2019, picking up instead in the movies and entertainment segment.

    Figure 6 Transaction Multiples

    EV/Revenue

    Source: S&P Capital IQ

    EV/EBITDA


    The spread of EV/Revenue multiple across segments deals was in the range of 3–4x. Cable and satellite deals were completed at higher multiples than those in other industries.

    Even in terms of EV/EBITDA, the movies and entertainment segment had a much higher spread than broadcasting and cable and satellite. Overall, cable and satellite deals were at a higher premium.

    The AT&T-Warner and Disney-Fox transactions, the biggest in the industry, took place at a EV/Revenue multiple of 3.8x and 2.9x multiple, respectively, a premium of almost 100% over the median multiple. The EV/EBITDA multiples were 13.5x and 12.9x respectively and were more in line with the median multiple.

    The Future
    While each media company is planning to launch an SVOD service, the market is already saturated with services. Newcomers will need to invest heavily in marketing and content in order to attract subscribers and in technology to deliver content. Licensing of content used to be a key part of the business model adopted by studios, but with the licensing model not as profitable as SVOD, content creators are preferring to hold on to their content to provide it as their own service.

    The media M&A space has been very active in the past with both blockbuster and minor deals ─ this is likely to continue in future. The new age business model entails high capital expenditure and global distribution which will necessitate consolidation. In the new media landscape, any company with enterprise value less than $50 billion is at a severe disadvantage and must either consolidate or sell out. This is great news for studios like MGM and Sony that have recognizable content and can inflate the value of their catalogue as part of acquisition talks.

    While the pace of deals is expected to continue, the momentum would not come from major companies. After a string of high-profile acquisitions, Disney has announced plans to slow down. Netflix has always been cautious about acquisitions, preferring to leverage its significant trove of data to invest in originals, and we believe the trend would continue. After the launch of Apple+, Apple may be looking to acquire a production studio in order to boost the content currently available on the service. While ViacomCBS is just coming out of a major merger, it would still need to consider another merger in order to compete with the majors. Smaller companies such as Discovery, AMC Networks, Lions Gate, MGM and Sony are expected to participate more actively in deals.


  75. Market reactions on Coronavirus, Is it overhyped?

    The outbreak of the deadly coronavirus in China has already started affecting various business sectors either directly or

      to read | words

    The outbreak of the deadly coronavirus in China has already started affecting various business sectors either directly or indirectly. As the death toll in the country climbs, China is forced to take preventive measures and focus its efforts on people’s health and safety. Increased leaves in factories, along with decreased travel and shopping, are already dragging a few sectors down. Will these effects lead to a global downturn or will they be a short-term panic attack? What will be the impact of this virus on the world economy? We attempt to answer these questions in this article.

    The coronavirus, originating from China, has spread to other parts of the world, and is a sinister reminder of the dreaded SARS epidemic that affected Asian countries in the early 2000s. An early alarm and proactive steps taken by the Chinese government have enabled other countries to contain the damage. However, since the virus broke out during the Chinese New Year, the main period of shopping and travel for the Chinese, several sectors and countries would be adversely affected at various levels. Stock markets across the world reacted negatively to the news of the virus outbreak, but resumed an upward trend immediately. The situation is evolving; the extent of the impact of the virus can be determined after the situation stabilizes.

    Global markets nosedive as coronavirus spreads
    The coronavirus outbreak is mainly concentrated in China. A report on the demise of people in the Hubei Province in late December 2019 led to the identification of this virus. Novel coronavirus (nCOV) is a new respiratory virus that was first identified in Wuhan (Hubei Province, China). The death toll in the country has risen rapidly since then, with the current count standing at 425 and the number of confirmed cases at more than 20,000 as of February 04, 2020. Moreover, the virus has spread outside China, with more than 190 confirmed cases. Other countries reporting confirmed cases of virus infection include the US, Hong Kong, Australia, Malaysia, India, Thailand, France, Japan, Singapore and South Korea. To safeguard their citizens, several countries are planning to evacuate them from China, while the US and Japan have already initiated the process. The WHO declared fast spreading coronavirus as a global health emergency, but at the same time opposed any restrictions on trade and travel against China.

    The fear of the virus spreading and affecting the economies was reflected in the stock market reaction across the world, which saw a low-single-digit fall, driven by the increase in confirmed cases in the US. Even though Central Bank of China pledged to inject CNY1.2tn (USD 174bn) worth of liquidity through reverse repo operations, the Chinese stock market slumped and lost more than USD 400bn of value, with the Shanghai composite declining over 7.0% on February 3, its first trading day after the Chinese New Year.

    The 10-year US Treasury bond yields tumbled 5 bps to 1.62, reaching their lowest level since October. Gold prices climbed 0.8% to USD 1,580 per ounce, as investors sought safe havens. Brent crude prices also fell 3% and was below USD 60/bbl

    Initial Stock Market reactions to outbreak of Coronavirus (January 27th)

    Source: Bloomberg * Hang Seng returns as on January 29th

    Given that the coronavirus outbreak is in a very early stage, the market has not declined significantly as it awaits more clarity on the severity of this epidemic. Currently, the market seems to have factored in the initial concerns.

    Mortality rate of Coronavirus significantly lower compared to SARS
    Parallels can be drawn between nCOV and the severe acute respiratory syndrome (SARS) outbreak that occurred in China in 2003. In the early months of 2003, markets tumbled amid the outbreak of SARS, but eventually the major indexes reinstated themselves and were stable by the end of the year. The S&P 500 was down approximately 10% in the early months, but ended up rising more than 26% for the whole year. The new coronavirus is still in the nascent stages and not as aggressive as SARS. However, its cases are eventually expected to outnumber those of SARS, with a lower mortality rate. When the initial cases of SARS were detected in November 2002, the Shanghai stock market fell and returned to its November level in January 2003. It plummeted again in 2003 and the losses were recovered by January 2004. The Hong Kong stock market followed suit, first declining 16% between November 2002 and April 2003 and recovering all losses by July 2003.

    Source: CNBC (As of February 4th 2020)

    From an economic point of view, SARS slashed the Chinese GDP growth rate from 11.1% to 9.1% in Q3 2003. According to past data, market sentiment improved once the number of cases started decreasing.

    The new coronavirus is a serious issue in China, but only two deaths (Philippines and Hong Kong) have been reported so far in other countries. Hence, in the short term, a severe effect outside China seems unlikely. Most countries are focusing on curbing the spread. The extent to which the Chinese economy would be hampered cannot be gauged yet, as the extremity of the virus is still unknown.

    Thailand and Japan would be most impacted, apart from China, while other countries also face short-term pressures
    Being the world’s second largest economy, China is connected to all the other countries directly or indirectly. Therefore, any slowdown in its economy would certainly put the brakes on global growth.

    Factors such as cancelled tours, suspended flights, a momentary shutdown of restaurants, extended nationwide holidays resulting from the coronavirus outbreak have created havoc in China (Mainland). Sooner or later, several other geographies, especially Thailand, Japan, Hong Kong, and Singapore, would face a near-term economic downturn and prolonged nationwide trauma due to excessive precautionary measures.

    Wuhan, referred to as "the Chicago of China," is the hub of transport and industry for central China and is the engine of growth for the world’s second largest economy. It is also the center of 300 Fortune 500 companies, including Microsoft and SAP. Wuhan registered GDP growth of 7.8% in 2019, even higher than China’s 6.5%. Currently, Wuhan is facing a complete shutdown, and all transport links to the city have been closed. This would mean China’s GDP growth would be slashed 0.5–1% against a forecast of 5.9%, as per EIU estimates.

    China has recorded more than 6% of GDP growth over the last 10 years. Household income rose rapidly, which triggered foreign visits by Chinese people across the world. According to official figures, about 134 million Chinese visited foreign countries in 2019, an increase of 4.5% YoY.

    Thailand is the most preferred tourist destination for Chinese people. Tourism accounts for roughly 18% of Thailand’s GDP. Between Thailand and China, there are more than 220 flights available per day. Moreover, approximately 40 million tourists visited Thailand in 2019 (up 7% YoY), of which around 11 million were Chinese (up 4.4% YoY). Any further spread of the dreaded virus would hit the Thai economy hard.

    Japan is economically dependent on China as it is the country’s second largest export hub. The Chinese have unimaginable consumption power for Japan’s retail products. In 2019, Chinese accounted for about 30% of the tourists that visited Japan and 40% of the total value spent by foreign tourists. Japan may face more difficulties in handling the impact of coronavirus as it is going to host the 2020 Summer Olympics from July to August 2020.

    As part of the phase one trade deal with the Trump administration, Beijing had pledged to purchase more of US products for several years. However, in the event of such an economic crisis, it seems unlikely that Beijing would be able to live up to its promise.

    Luxury goods, airlines, automobile sectors to be hit severely, while overall healthcare sector stands to benefit in short term
    The coronavirus surfaced in China during the most important period of travel and purchases, the Chinese New Year. We estimate that while most sectors would be impacted to some extent, certain sectors would face a material adverse effect in the short term.


    We expect most sectors to be negatively impacted at various degrees. The travel and leisure sector, which includes the airline, luxury goods, and hospitality industries, would be directly impacted, while other sectors such as automobiles and electronics, for which China is a major hub, would also be indirectly affected. The key beneficiary in the short term would undoubtably be the healthcare sector.

    Conclusion
    It is too early to say the virus which has struck China’s economy, is leading to a dominoe effect across the globe. The virus-hit country is taking precautions to contain the virus and eliminate its risk. If it is successful in this endeavor, the affected sectors would slowly recover and the current impact on stock markets would balance out. We need to wait and watch.


  76. The Future of Digital Lending in India

    Digital lending is leading the FinTech revolution. Though still in the nascent stage, it has managed to gain

      to read | words

    Digital lending is leading the FinTech revolution. Though still in the nascent stage, it has managed to gain a strong foothold in India. Various models are currently being used, as it slowly evolves and becomes sophisticated. In this article, we explore the potential of digital lending startups in India, along with factors driving growth and the role of various government initiatives to support it.

    Introduction
    Traditionally, lending has been a give and take transaction, wherein the lender gives some money to the borrower in return for some profit (interest) on the money. This sector was highly unorganized earlier. Over a period, it has evolved from pawnbrokers lending money by taking a collateral to be a more structured process involving banks and/or financial institutions. With the rise in technological innovations, in this case, FinTech, lending has also undergone transformation and turned ‘digital’.

    Digital lending models in India

    1. Peer-to-Peer or P2P lending – This refers to a digital marketplace where a borrower, be it an individual or a company, is connected with a lender. No middlemen or financial institutions are involved, facilitating quick and streamlined transaction. The rates are mutually agreed upon by the two parties, while a fee is charged by the marketplace platform which can be a flat price or a percent of the transacted amount. Some examples of P2P platforms are Faircent, i2iFunding, and Lendbox.
    2. Paylater loans – These loans are digital credit products allowing a ‘buy now and pay later’ policy. The customer is instantly credited the required amount based on his/her spending and repayment history. These loans are of small ticket size with an interest-free repayment period, post which a late fee is charged. Some examples of this model are Amazon Pay and BajajFinserv.
    3. Bank-led digital platforms – These platforms are similar to digital marketplaces, wherein the lender is a bank instead of another individual/company. The bank charges interest on these loans based on their prevailing rates. Examples are Kotak Mahindra Bank’s 811 application, and HDFC Bank’s 10-second personal loan.
    4. Invoice financing – This model is mainly applicable for companies that are looking for working capital for their day-to-day operations. Such requirement can be met with discounting the unpaid customer’s invoices. It is used to meet short-term liquidity shortage by accelerating trade receivables. Some examples are Indifi and KredX.

    Advantages of digital lending

    1. Transparency – FinTech companies have a transparent loan process, giving the borrower complete visibility. If a loan application is rejected, the applicant is given clear reasoning for the same, allowing the person to make amends.
    2. Speed – Technology enables processes like collection of borrowers’ information, its validation and disbursement of loan to become quick and seamless. Within a few days of application, a borrower can expect the loan to be credited to his account. Some FinTech players even claim to process loan within an hour also, if the information provided by the borrower is found to be correct.
    3. Technology and data processing – Technological innovations have refined data processing, resulting in faster and accurate output.

    Growth of digital lending tech startups in India
    Digital lenders are adopting technology to enhance customer experience and operate more efficiently. They use artificial intelligence and machine learning (ML) to improve customer acquisition process and reduce costs. Including alternative data for credit underwriting and adopting complex risk management solutions have led to major improvements in lending activities, including collection management and loan resolution.

    Digital lenders are growing at a rapid pace, with a steady infusion of investment, both globally and in India; this is a testimony to the huge potential of this sector. The chart below elaborates the trend in startup funding over Q1 2015 to Q1 2019.

    Trend in Startup funding in Indian Lending Tech startups
    (QoQ; in USD mn)

    Source: The Boston Consulting Group Report

    In India, the transaction value of digital lending (crowd lending, business and marketplace lending, and consumer lending) is estimated to increase at a CAGR of 2.8% from approximately USD 118.4 billion in 2019 to USD 132.4 billion in 2023. As of 2019, India’s digital lending transaction value is estimated to have been just 0.005% of the global digital lending transaction value vis-à-vis market leader China’s massive 91%.

    Crowd and Marketplace lending transaction value in India
    (in USD mn)

    Source: Statista

    Country Crowd and Marketplace lending transaction value as a percentage of worldwide digital lending transaction value in 2019

    Source: Statista

    Factors driving growth in digital lending in India

    1. Digital natives
      Today’s generation is highly exposed to technology. It has simplified their life, especially with most of the usual activities such as ordering food or shopping going online. As per the Ministry of Statistics of India, approximately 35% of India’s population is in the age group of 15–34 years, with the Internet-savvy youth constituting most of this segment. They are the potential customers for digital lending.

    2. Big data
      Over two-thirds of the world has access to mobile services and smartphones today. The boom in mobile users over a short period of time has created opportunities for many companies operating on big data. Knowledge of customers’ daily habits, buying patterns and other behavioral details has allowed companies to gain valuable insights that has further helped them in strategizing. Big data has also contributed to the FinTech revolution, enabling innovators to design as per customers’ requirements.

    3. Rise in innovative lending models
      Customer-centric operating models have given the biggest boost to the digital lending space. Adoption of such models by FinTech companies, financial aggregators etc. has accelerated growth in digital lending across the globe.

    4. Supportive regulatory environment
      Financial regulators are devising policies and procedures favorable to digital lending. In many developed economies, regulators have created ‘sandboxes’ to support and speed up innovations in the sector. The Indian government has also developed and implemented the India Stack, an open architecture platform for authentication and data access.

    Government policies, regulations and infrastructure
    Some of the key initiatives by the Indian government and regulators that have given a boost to FinTech solutions across the country are given below:

    • Driving financial inclusion by the introduction of Goods and Service Tax (GST) has been a key step in formalizing the unorganized sectors of the Indian economy. Many FinTechs are leveraging the digital footprint generated from the Goods and Services Tax Network (GSTN). Separately, the Jan Dhan Yojana has resulted in a significant rise in the number of people with bank accounts in India (approximately 320 million accounts were opened under the scheme), laying the foundation for the delivery of banking services to the unbanked.
    • Many FinTechs and institutions have introduced the Unified Payments Interface (UPI), a payment service, which has led to the adoption of digital payments by merchants and customers. In June 2019, the platform was used by more than 144 banks and witnessed 754 million transactions worth INR 1.46 trillion from less than half a million transactions in 2016, making it one of the largest and rapidly growing payment platforms across the world.
    • The Digital India programme to improve digital literacy across the country by providing easy access to digital services has made a significant impact. It has increased digital understanding among the country’s rural population. Also, awareness of FinTech solutions has increased, boosting their usage.
    • The RBI has set up a regulatory sandbox for FinTech startups. The sandbox allows real-time testing of new products or solutions in a controlled regulatory environment before a potential scale up. A first-of-its-kind initiative by the regulator in India, it is expected to encourage organizations and startups looking to enter the industry.

    Conclusion
    The digital landscape is shifting continuously. In India, growth is slow but steady. Moreover, our banking system has begun to tap the vast opportunities present online, facilitating easier and faster access for customers. Banks are also providing fully integrated mobile experience, wherein customers use their smartphones or tablets to do everything from opening a new account and making payments to resolving credit card billing disputes, all without ever setting foot in a physical branch.

    Digital lending is a part of this dynamic environment. The huge funding received by digital lending startups over the last few years indicates its immense potential. However, compared to the pace of development in China’s digital lending space, India is still at a nascent stage. Digital lending is complex as well as constantly shifting, which makes strict categorization difficult. However, innovators continue to test, refine, and develop their business models based on customers’ needs and market experience. The Indian digital lending domain has huge potential and with the support it is receiving, it should soon catch up with its Western counterparts.


  77. US-China Trade War: And The Winners Are...

    Over the last year and a half, the US-China tariff war has had a significant impact on trade

      to read | words

    Over the last year and a half, the US-China tariff war has had a significant impact on trade diversion, creating both winners and losers. It has reshaped supply chains globally. The hike in tariff prompted the US to shift its supply chains to other Asian countries, while Chinese firms increased sourcing of goods from the Americas, excluding the US. Vietnam emerged as the biggest beneficiary and has since seen the most significant increase in market share, particularly in electronics and textiles. Asia’s other emerging economies, such as Bangladesh, Taiwan, and Thailand, have also benefitted from the trade war.

    The US-China trade war is one of the biggest factors behind the recent global economic turmoil. It is primarily a result of the US’s efforts to reduce its trade deficit with China and promote domestic manufacturing. Until now, the US has imposed tariffs on goods worth USD 370bn. Imports from China to the US totaled USD 550bn, accounting for 21.6% of the US’s total imports in 2018. The US imposed three rounds of tariff increases in the last year alone, the latest being enforced in September 2019. The latest round includes tariffs on clothing, sporting goods and other consumer goods, with a 15% duty (halved to 7.5% in the latest deal) on Chinese goods worth USD 120bn. In retaliation, China levied tariffs in the range of 5–25% on US goods worth USD 75bn. This also includes a 5% tariff on US crude oil. This is the first time oil has got caught up in a trade war. On a positive note, trade tensions between the two are expected to ease as we move toward 2020, with both nations reaching phase one deal to end the ongoing dispute.


    Following the imposition of the latest round of US tariffs on Chinese goods, importers in the US began to seek alternate locations, mainly other Asian countries, for electronic products, furniture and textile goods. China, on the other hand, tilted toward other countries in the Americas (excluding the US of course) for sourcing raw materials, such as soybeans grains and cotton. Given the size of the US and Chinese economies, the substitution effect, even if small, can give a substantial boost to exports from smaller countries.

    Source: US Census Bureau

    Emerging countries are benefiting due to the shift in demand where they have an advantage over other nations. With China’s trade with the US declining, exports from Asian countries such as Vietnam, Taiwan, Bangladesh, and Argentina to the US increased in 2019. Data from the United States Census Bureau shows that the US’s imports from major developing Asian countries (excluding China) rose 8.6% Y/Y (pre tariff – 4.0% Y/Y) in the last 12 months until September 2019, even as imports from China and Hong Kong fell 12.1% Y/Y and 28.4% Y/Y, respectively, during the same period. On the emerging economies front, US imports from Vietnam grew 28.9% Y/Y, from Taiwan by 19.5% Y/Y, and from Bangladesh by 9.5% Y/Y.

    Source: US Census Bureau

    Source: US Census Bureau


    Vietnam is the biggest beneficiary of the diversification in supply chain. The country recorded LTM growth of 67.5% Y/Y in September 2019 in the electrical machinery and equipment space. FDI inflow also surged over 60% in the manufacturing sector, including the labor-intensive electrical and electronics manufacturing segments. According to Vietnam’s Foreign Investment Agency (FIA), FDI increased 69% Y/Y to USD 16.7bn in the first five months of 2019. It further added that the number of new projects rose 39% to 1,400. In the furniture and other imports category, the Philippines is the top gainer with LTM growth of 42.4% Y/Y, followed by Vietnam (31.1% Y/Y), Malaysia (18.1% Y/Y) and Thailand (15.9% Y/Y).

    Over the last few years, multinational firms have increasingly relocated their production processes in stages to Asian countries with low cost of labor (such as China, Vietnam, Bangladesh and Taiwan) as they look to benefit from the comparative cost advantage of international trade. However, amid escalating trade tensions between the US and China, companies with industrial bases in these countries have been compelled to reconsider their strategies. Many companies are scaling down their facilities while some are relocating plants elsewhere, such as Vietnam, Bangladesh and Thailand. According to reports, China’s GoerTek, one of Apple's key contract manufacturers, is set to move the production of Apple AirPods to Vietnam. Meanwhile, Google recently announced plans to shift Pixel smartphone production to Vietnam from China. Japan-based electronics giant Sharp has also shelved plans to produce displays for the American market in China. Alternatively, the firm is now planning to set up a plant in Vietnam with operations likely to commence in 2020. Consumer electronics manufacturers Nintendo and Kyocera too intend to move their production facilities to Vietnam from China.

    Source: US Census Bureau

    Source: US Census Bureau


    Bangladesh witnessed the highest LTM growth of 10.7% Y/Y in textiles segment, followed by Vietnam (10.6% Y/Y), Pakistan (+10.5% Y/Y) and Indonesia (+8.5% Y/Y). While the market shares of these countries have improved, China retains its position as the top exporter with a market share of 31.9% (-130bps Y/Y). Bangladesh and other emerging countries are expected to record further growth in this segment, as retailers from the US continue to place more work orders in their bid to offset costlier imports from China following increase in tariffs.

    To explore the potential created by this drift, Asian countries are introducing investor-friendly regulations to attract foreign investments. Thailand recently launched a new stimulus program, Thailand Plus Package, to get more FDI, mainly those from China. Under it, companies are eligible for a 50% reduction in corporate income tax (CIT) for another five years, provided they invest at least USD 32mn. Cambodia approved laws on e-commerce and consumer protection to encourage investment in the online business. India too joined the bandwagon, lowering its corporate tax rate to 22% from 30%.

    Overall, the US’s tariffs on China are impacting both countries—US consumers are paying higher prices for products manufactured domestically, while China’s market share is taking a hit amid significant export-related losses. Many US-based companies are looking at alternative options in Vietnam and other countries. Lately, the US and China reached a phase one deal to end the trade war, where the former agreed to halve its 15% tariff to 7.5% on Chinese goods worth around USD 120bn, in addition to suspending the planned duties that were set to take effect from December 15, 2019. China is yet to agree on any specific tariff reductions. The trade war might subside in the near future, but this may be a wake-up call for firms with industrial bases in China. Thus, firms are expected to scale up their value chain in the emerging market space (outside China), driven by low labor costs, favorable investment policies, and good trade relations with the US. Therefore, Vietnam and other emerging countries would continue to attract investments from multinational firms, as they diversify their operations to hedge against losses likely to arise from trade disruptions in the near future.


  1. Exploring the Rise and Impact of US RIA

    In the ever-evolving landscape of personal finance, individuals seek not only financial stability but also strategic guidance to optimize their investments. This is where Registered

  2. India's EMS Sector in Full Momentum

    COVID-19 pandemic and higher China dependency led to supply chain disruptions in electronic components and finished goods. Consequently, the global electronic manufacturing giants reduced dependency

  3. India’s Electric Vehicle Transition Roadmap

    India envisions electric vehicles (EVs) dominating its future roads. Driven by a shift in global climate policies, consumer preference for environment-friendly transport options, and an

  4. Broadcom Inc. acquires VMware

    Broadcom (AVGO.O) announced its intention to acquire cloud-computing firm VMware (VMW.N) for $61 billion, along with assuming an additional $8 billion of the company's debt

  5. M&A in Aerospace and Defense | Q3 2023

    The aerospace and defense (A&D) industry is highly competitive, with a limited number of major players. Consequently, mergers and acquisitions (M&A) activity in

  6. US Housing Market Overview

    The surge in home prices in the US in 2021 can be attributed to a combination of factors, including the increased housing demand as owning a

  7. Microsoft – OpenAI Partnership

    Microsoft and OpenAI entered a partnership in 2016, with OpenAI committing to use Microsoft’s Azure as its primary cloud provider. Both companies saw the potential i

  8. High Yield – US Spotlight

    After recording a plunge in the US high yield bond returns in 2022, the Federal Reserve’s aggressive monetary policy stance to tame inflation proved crucial i

  9. High Yield - Europe Spotlight

    The European HY market rebounded in 2023, with benchmark HY index generating YTD 6.1% returns. Amid rising interest rates, HY bond returns outperformed IG returns due

  10. US Regional Banks’ Crisis is Far From Over

    US regional banks continue to grapple with the same underlying problems that triggered the crisis, i.e., valuation losses on fixed-income investments, increased cost of

  11. Q2 2023 Global Macro Report

    Q2 posted a slowdown in global economic growth along with strong returns in risk assets. The IMF expects global growth to be lower in 2023 than 2022

  12. M&A in Artificial Intelligence | Q1 2023

    Artificial intelligence has been a buzzing term for quite some time now. The sentiment continued as we entered the first quarter of 2023, with the M

  13. Revenue Swing Analysis of S&P 500 Companies

    S&P 500 companies generated $4 Trillion revenues in 4Q22 – a -11% revenue growth swing in 4Q22 dragged down by Technology, Basic Materials and Energy sectors.

  14. SVB Crisis: Snowballing Down the Valley

    California-based Silicon Valley Bank (SVB), which specifically catered to startups, went bankrupt after it reported huge losses on investments. The bank received an influx of

  15. Global M&A - Q3 2022

    In the third quarter, dealmakers’ appetite for M&A fell even further. The number of global M&A transactions declined for the third consecutive quarter i

  16. GCC - Equity Market Quarterly Fact Book

    Most GCC equity markets recorded gains in Q3 2022, with the Oman market outpacing other GCC markets, while Qatar, UAE, and Bahrain benchmarks also ending in

  17. Greenflation

    The race to achieve net zero emissions is the recent global trend to promote carbon neutrality. Greenflation is one of the consequences of the popular

  18. Islamic Finance

    The global Islamic finance industry is worth over USD2 trillion and is projected to grow to ~USD5 trillion by 2025. However, the global economy has been

  19. High Yield - Europe Spotlight

    European HY bond market returns declined in YTD 2022, owing to heightened geopolitical tensions and rising interest rate risks. Issuers largely stayed on the sidelines in 2022

  20. EV Trends in India

    With increasing global awareness and targets to reduce carbon emissions, the government has been supporting the adoption of electric modes of transport in India. Several

  21. Metaverse – Mapping Investment Opportunities

    The COVID-19 pandemic has led to a rise in consumers’ expectations and need for more fulfilling and immersive communication methods. Numerous consumers are seeking ways t

  22. High Yield – US Spotlight

    Rising Inflation, supply-chain disruptions, and tightening financial conditions have created a negative sentiment amongst the investors. In Year-To-Date 2022, the US High Yield funds witnessed net

  23. GCC - Equity Market Quarterly Fact Book

    In 2Q22, all the GCC benchmarks ended lower, largely reflecting the trend in the global markets, which are facing negative bias due to inflation and

  24. Changing Energy Dynamics Amid Russia-Ukraine Conflict

    In line with the Paris Agreement, countries across the globe have implemented net-zero emission (NZE) initiatives to decarbonize electricity generation by 2050. However, the conflict

  25. Semiconductor Supply Chain Analysis

    Heavy dependence on Asia for semiconductor manufacturing has put undue stress on the whole supply chain in recent years. Demand–supply imbalance across the world h

  26. ESG Investing

    ESG remains a fast-evolving topic. With more than a decade under the spotlight, investors and customers are now demanding clear commitments from corporations 

  27. ESG: A Bumpy Road to Net Zero

    Achieving net zero by 2050 involves a complete change in how energy is produced, transported, and consumed. The green transition hinges on unprecedented deployment of available

  28. Neobanks - The Future of Banking

    Neobank is the new buzzword in finance and is being touted as the future of banking. Neobanks thrive by disrupting banking system with their customer-centric

  29. Navigating the Russia-Ukraine crisis

    The Russia-Ukraine Crisis has shaken global markets and fired up commodity prices. The barrage of sanctions imposed on Russia will have far-reaching effects on the

  30. Asset Quality Trends and Risks across European Banks

    Since the onset of COVID-19, European banks’ exposure to small and medium enterprises (SMEs) and mortgages increased materially, supported by highly accommodative fiscal and monetary p

  31. GCC - Equity Market Quarterly Fact Book

    Most GCC equity markets continued to log gains during Q4 2021 despite the emergence of the Omicron variant of COVID-19. The UAE markets were the most

  32. Aviation Industry: A Long Road to Recovery

    The global aviation industry was hit harder by the COVID-19 crisis than the catastrophic events of 2008 financial crisis and 9/11 combined. However, the industry sees signs

  33. Build America Bonds

    Federally subsidised BABs were launched more than a decade ago to fund infrastructure projects amid the liquidity crunch during the 2008 global financial crisis. Some features

  34. Growing Popularity of Celebrity-Led SPACs

    The SPAC boom continued in 2021, with SPACs raising USD109 bn in funds in H1 2021 breaking the 2020 funding record, and once again raising more money and

  35. US to Reignite Growth with Infrastructure Push

    The economic impact of the COVID-19 pandemic is staggering and long-lasting, with every sector feeling the brunt. To address this, the Democrats and Republicans have

  36. Pharmaceutical & MedTech: Edging Toward Normalcy

    Healthcare, like other sectors, was hit by COVID-19 in 2020. This especially holds true for the pharmaceutical and MedTech sub-sectors in healthcare that were impacted in

  37. Testing Times Ahead for Global Banks

    Regulatory reforms that followed the global financial crisis have boosted capital buffers substantially and improved the liquidity of global banks. As 2021 progresses, the years ahead

  38. Green Bonds: An Emerging Asset Class

    The growing significance of environmentally sustainable projects has increased the importance of the green bond as an asset class in funding these projects. This reports

  39. US Bankruptcy Dashboard – March, 2020

    Q1 2020 Chapter 11 bankruptcy filings in the US were at par with the trend seen in 2019. That said, almost all leading indicators are currently suggesting Q2