Is the US economy heading toward a significant market correction?
Published on 06 Mar, 2020
The US markets suffered its worst week in over a decade as investors went into panic mode with the S&P 500 losing almost 11.5% in a week, rapidly wiping out nearly a year’s worth of steady gains. With the longest ever 128-month expansion, investors are skeptical about a significant market correction in the short term. Moreover, the impact of coronavirus may weaken the Chinese economy and, in turn, US and other markets. Though economic indicators, such as the yield curve inversion and PMI data, provide substantial evidence for a correction, valuations remain on the higher side.
There have been mixed signals from the US economy and markets about the likelihood of a recession on the horizon. According to the National Bureau of Economic Research, following the global financial crisis, the US economic recovery and expansion made history in July 2019 by breaking the previous run during the dotcom bubble between March 1991 and March 2001 for a period of almost 120 months. With the longest ever 128-month expansion, all eyes are on the clock to see just how long the current expansion can keep going.
The year 2019 became the best period for return generation and wealth creation across asset classes, with the S&P 500 soaring to new highs and returning close to 28%.
Expansion/Contraction Months
Source: National Bureau of Economic Research
Year represents the start year for the cycle
With the markets currently in unchartered territory, let us look at factors that might hint at a chance of a significant market correction in the near term.
US Treasury Yield Spreads
An inverted yield curve occurs when the yields on bonds with a shorter duration are higher than those on bonds having a longer duration. Yield curve inversion is a leading indicator of economic downturn and has successfully signaled recessions for the last 50 years. As per a Credit Suisse report, the economic downturn can happen anywhere between 14 and 34 months after yield curve inversion.Yield curve inversion is among the most consistent recession indicators, but other supporting metrics can give a better sense of its potential impact.
10yr and 1yr US Treasury Yield Spread
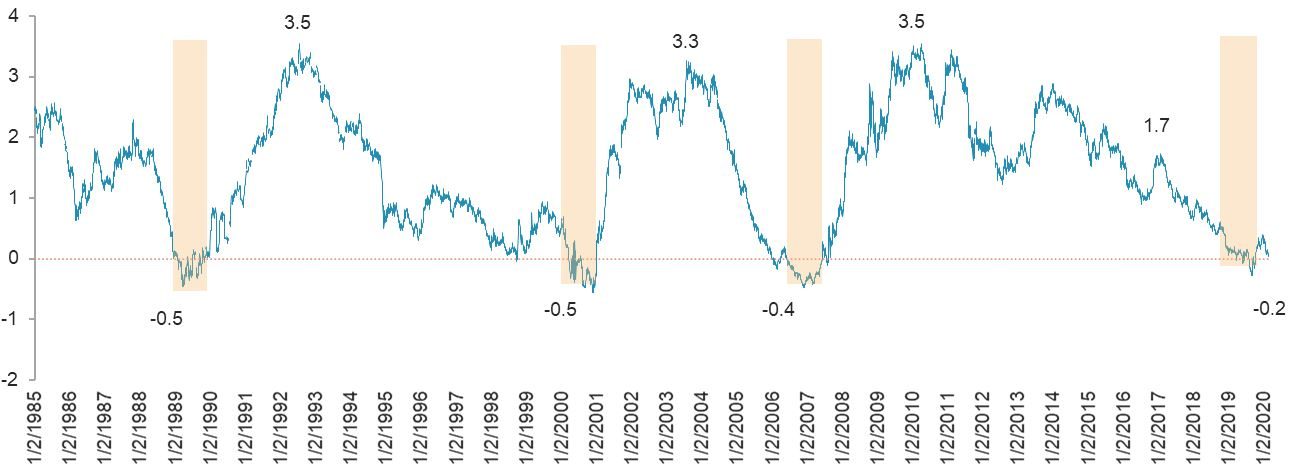
Source: Thomson Eikon
On the basis of historical data, the significance of an inverted yield curve in predicting recession cannot be ruled out. The Treasury yield curve inverted before the recessions of 1992, 2002, and 2008, and now the yield spreads for 1-year and 10-year US Treasury turned negative in August 2019. Therefore, taking this analogy into consideration, we can expect a significant downturn in the short term.
US Jobless Claims
Jobless claims are a rough measure of how many people are losing their jobs. With claims at the lowest levels in 50 years and hovering around the 200,000 mark, the US economy has seen a record improvement in employment levels.Jobless Claims in 000'
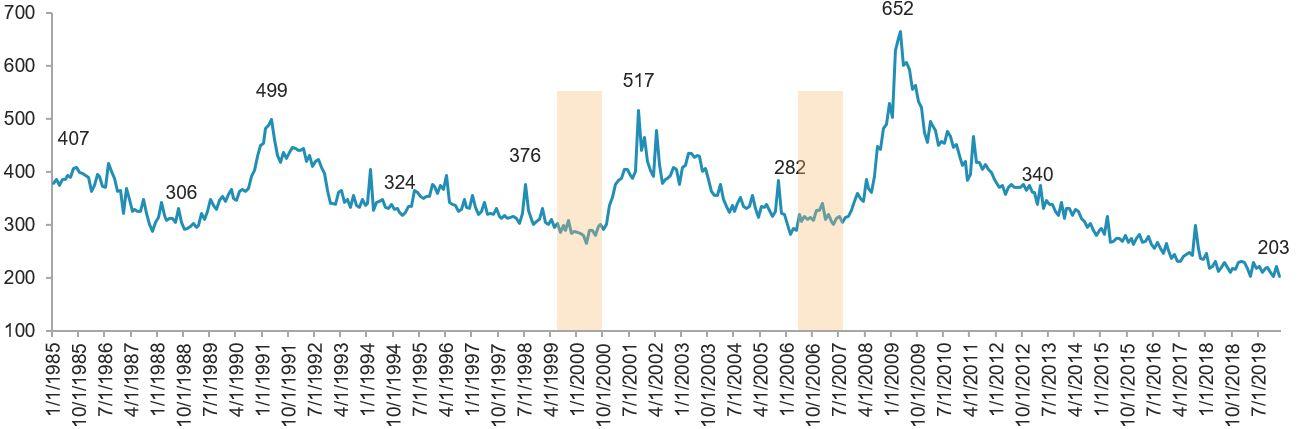
Source: Thomson Eikon
Historically, unemployment claims reach their minimum and begin trending upward prior to the beginning of recession. Since recessions are associated with reductions in output, and as a result, in job severances, economists consider a sudden surge in jobless claims to be extremely relevant to an economic downturn.
The initial jobless claims tend to reach a trough several months before economic recession, and when it begins, the indicator rises sharply. For example, the unemployment rate reached its lowest level prior to the outbreak of the global financial crisis in May 2007, seven months before the official commencement of the recession, and earlier in April 2000, eleven months before the 2001 recession.
As of the end of February 2020, jobless claims were still in a downward trend, so this data series is positive and does not indicate an upcoming recession yet.
US Manufacturing Purchasing Managers’ Index
The US Manufacturing Purchasing Managers’ Index (PMI) is a diffusion index incorporating survey results provided by manufacturing firms throughout the country. A reading above 50 suggests the manufacturing sector is expanding, while a reading below 50 suggests the manufacturing sector is contracting.The PMI is an extremely important indicator for international investors seeking to form an opinion on economic growth. Many investors use it as a leading indicator of economic growth or decline. Central banks also factor in the results of PMI surveys when formulating monetary policy.
US PMI Data
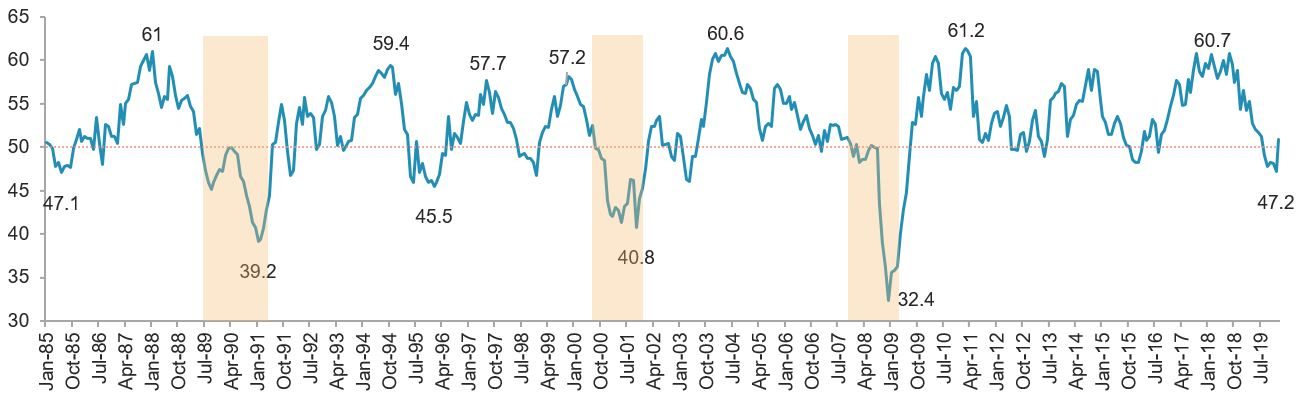
Source: Investing.com
The US PMI was down toward the end of 2019 and has been at its lowest since the 2008 global financial crisis. While the US manufacturing sector indicates evident contraction, jobless claims show signs of factories suffering from a global slowdown even though employment remains healthy. This can be partly attributed to the trade war between the US and China. In addition, markets have started to feel the pinch from the coronavirus impact, which may cause further contraction in the manufacturing sector.
A decline in China’s growth presents outsized risk for global economies and markets. As per a report by Deutsche Bank, China represents approximately 15% of global GDP and total global oil demand and accounts for over 30% of global GDP growth and global oil demand growth. The US economy largely depends on the Chinese economy, with 20% of its imports coming from China. Therefore, any supply-side shock will have a negative impact on the US economy.
S&P 500 Valuations
US markets had a dream run after the global financial crisis of 2008 and have grown close to 4.5x in a decade’s time. Markets have remained buoyant with the longest ever 128-month expansion, and a correction in the near term could bring valuations significantly lower and provide investors an opportunity to buy.S&P 500
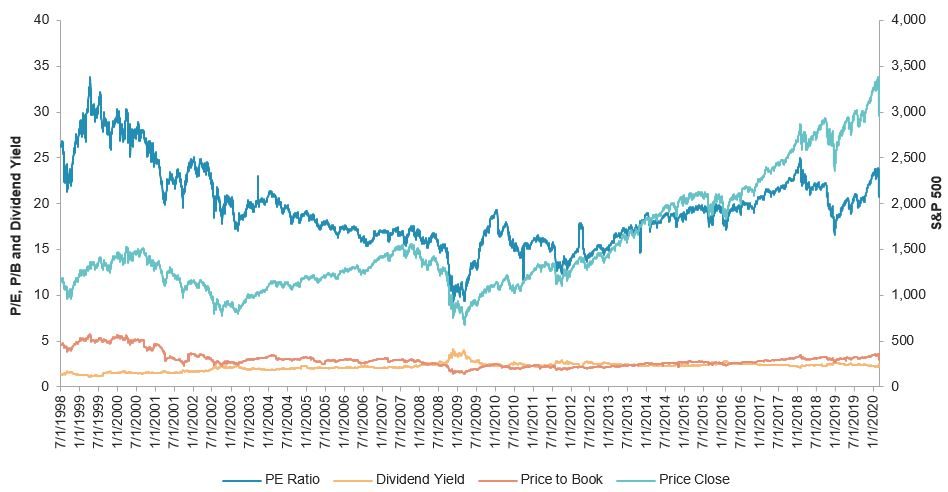
Source: Thomson Eikon
The US markets had expanded from 1996 to 2000, but this expansion was followed by the dotcom bubble burst in 2000, with the markets correcting by almost 40%. Thereafter, confidence started picking up again, with the markets rebounding to 2000 highs until 2008. During the global financial crisis, the markets corrected by more than 50% and the price/earnings (P/E) ratio reached the lowest level to 9.2x, thereby providing a golden opportunity to investors.
With the S&P 500 at around 3,000 at present, let us look at the historical multiple range:
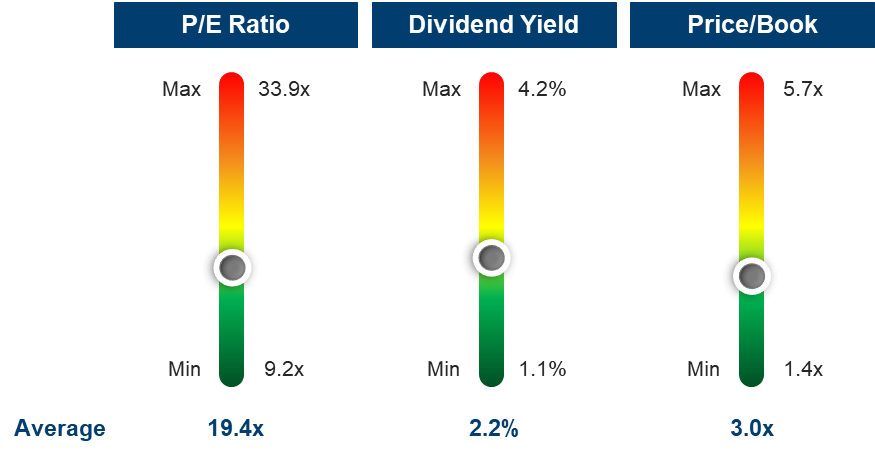
Ranges are calculated from data for 1996–2019
On the basis of data gathered for the last 23 years, we have classified data points in the range of the P/E ratio and calculated the possible returns one could have made by investing in these ranges, along with the average price/book ratio and dividend yield. A detailed summary of this data is provided below.
P/E Range
Avg 3-yr Return
Min 3-yr Return
Max 3-yr Return
Avg Price/Book
Avg Div Yield
9–11
57.16%
30.53%
102.63%
1.62x
3.62%
11–13
54.25%
10.23%
79.03%
1.82x
3.09%
13–15
50.89%
-6.42%
73.69%
2.07x
2.63%
15–17
12.18%
-46.82%
60.05%
2.47x
2.36%
17–19
19.03%
-46.55%
59.36%
2.70x
2.26%
19–21
28.97%
-5.89%
47.63%
2.90x
2.27%
21–23
16.35%
-13.39%
37.68%
3.17x
2.12%
23–25
3.07%
-23.01%
22.77%
3.58x
1.75%
25–27
-16.83%
-37.11%
12.22%
4.52x
1.51%
27–29
-29.33%
-42.45%
-1.95%
5.11x
1.49%
29–31
-27.15%
-43.42%
-8.97%
5.23x
1.36%
31–33
-22.07%
-39.77%
-8.99%
5.45x
1.15%
33–35
-16.94%
-18.23%
-15.39%
5.70x
1.08%
Values are calculated from data for 1996–2019
Historically, investors make decent returns by investing in stocks when P/E values upto 20x and outperform fixed income returns. Investors can expect exceptional returns of more than 50% in three years with a P/E ratio of up to 15x. One such golden opportunity was when the P/E ratio was ~9x in 2008. Not considering stock-specific investments, the overall markets had returned nearly 103% in just three years’ time.
Whenever there is a dividend yield and price/book crossover, markets have provided investors decent returns.
Taking into account the information presented above, let us see where the index stands today and what to expect next. Considering that the S&P 500 currently has a P/E ratio of almost 21x, we have summarized the relevant data below.
P/E Range
Avg 3-yr Return
Min 3-yr Return
Max 3-yr Return
Avg Price/Book
Avg Div Yield
21–23
16.35%
-13.39%
37.68%
3.17x
2.12%
23–25
3.07%
-23.01%
22.77%
3.58x
1.75%
Conclusion
To sum up, the yield curve inversion and US PMI data strongly indicate that markets are going to head south in the near term. Investors should closely monitor jobless claims and PMI data to gauge the economic prospects. Moreover, the valuations are not sufficiently enticing for investors to generate outstanding returns in the coming future. Any further developments on the coronavirus impact or US-China trade war should be consistently monitored.
If the US economy goes into a downturn, the global economy will also begin to spiral down.
